GBP/USD Price Analysis: Plummets and shift bearish, dives below 1.2500

Source Fxstreet
  • GBP/USD falls sharply, influenced by a move towards safer assets and a strengthening US Dollar.
  • Technical analysis indicates a shift to bearish territory after dropping below the 200-day moving average.
  • Recovery targets include reclaiming 1.2500, with resistance at the 200-day DMA.

The British Pound plunged against the US Dollar late in the North American session, down 0.74%, and trades at 1.2445 after hitting a daily high of 1.2559. Risk aversion triggered a flight to safety, a headwind for the Pound Sterling even though UK GDP figures were solid.

GBP/USD Price Analysis: Technical outlook

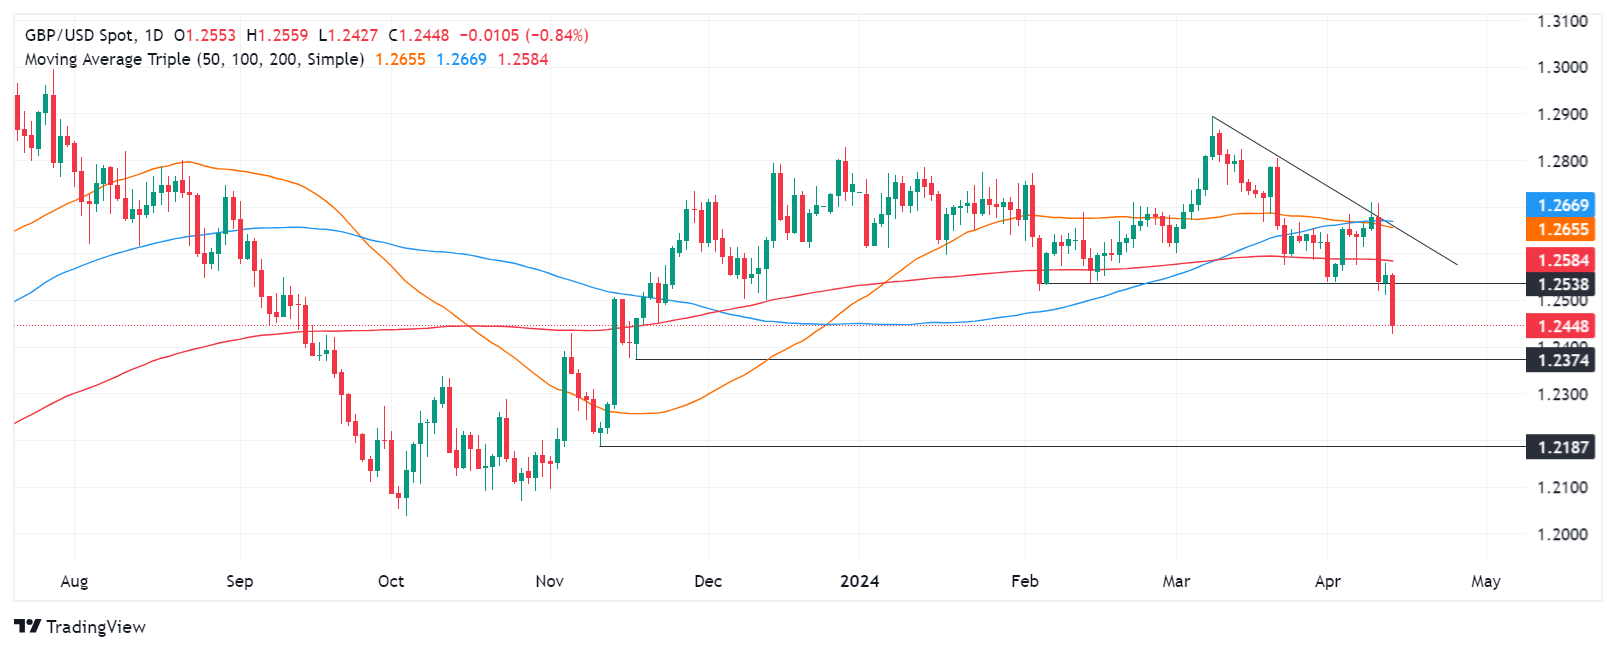
From a technical perspective, the GBP/USD shifted bearish as it achieved a successive series of lower highs and lows while breaching key support levels. On its way south, the pair cleared the 200-day moving average (DMA) at 1.2584, which opened the door to a tumble below 1.2500.

For a bearish continuation, the GBP/USD needs to clear the 1.2400 mark. A breach of the latter will expose the November 17, 2023, low of 1.2374, followed by the 1.2300 mark.

On the other hand, if buyers lift the GBP/USD past the 1.2500, that could pave the way for further gains. The next resistance would be the 200-day moving average (DMA) at 1.2584, ahead of 1.2600.

As the GBP/USD dropped below key support levels and achieved

GBP/USD Price Action – Daily Chart

GBP/USD

Overview
Today last price 1.2447
Today Daily Change -0.0106
Today Daily Change % -0.84
Today daily open 1.2553
 
Trends
Daily SMA20 1.2644
Daily SMA50 1.2659
Daily SMA100 1.267
Daily SMA200 1.2586
 
Levels
Previous Daily High 1.2579
Previous Daily Low 1.2511
Previous Weekly High 1.2684
Previous Weekly Low 1.2539
Previous Monthly High 1.2894
Previous Monthly Low 1.2575
Daily Fibonacci 38.2% 1.2553
Daily Fibonacci 61.8% 1.2537
Daily Pivot Point S1 1.2516
Daily Pivot Point S2 1.248
Daily Pivot Point S3 1.2448
Daily Pivot Point R1 1.2584
Daily Pivot Point R2 1.2615
Daily Pivot Point R3 1.2652


Disclaimer: For information purposes only. Past performance is not indicative of future results.
placeholder
When Will the Gold Dilemma Be Resolved? Breakdown of US-Iran Negotiations Puts Gold Prices Under Pressure Again, Can It Return to $5,000? Spot gold broke below the $4,700 level during the Asian trading session on May 11, dropping as low as $4,678. As of press time, it was trading at $4,670, in stark contrast to three days a
Author  TradingKey
9 hours ago
Spot gold broke below the $4,700 level during the Asian trading session on May 11, dropping as low as $4,678. As of press time, it was trading at $4,670, in stark contrast to three days a
placeholder
Hormuz Latest. Trump Rejects Iran Peace Plan; WTI Crude Hits $100 Again International oil prices surged in early Asian trading after U.S. President Trump and Iran rejected each other's latest long-term peace proposals. Both major crude oil futures rose by mor
Author  TradingKey
17 hours ago
International oil prices surged in early Asian trading after U.S. President Trump and Iran rejected each other's latest long-term peace proposals. Both major crude oil futures rose by mor
placeholder
Gold slumps below $4,700 on Trump rejection of Iran peace proposalGold price (XAU/USD) falls to around $4,690 during the early Asian session on Monday. The precious metal attracts some sellers after US President Donald Trump rejected Iran’s latest peace offer to end the 10-week conflict choking the Strait of Hormuz, fanning inflation fears. 
Author  FXStreet
17 hours ago
Gold price (XAU/USD) falls to around $4,690 during the early Asian session on Monday. The precious metal attracts some sellers after US President Donald Trump rejected Iran’s latest peace offer to end the 10-week conflict choking the Strait of Hormuz, fanning inflation fears. 
placeholder
Silver Price Analysis: Climbs above $80, as bulls eye weekly highSilver price advances more than 2.50% on Friday, set to end the week with gains of over 7% sponsored by US Dollar weakness and falling oil prices. At the time of writing, the XAG/USD trades at $80.72, after bouncing off daily lows of $78.16.
Author  FXStreet
May 09, Sat
Silver price advances more than 2.50% on Friday, set to end the week with gains of over 7% sponsored by US Dollar weakness and falling oil prices. At the time of writing, the XAG/USD trades at $80.72, after bouncing off daily lows of $78.16.
placeholder
April NFP Lands at 8:30 AM Today — 65K Forecast, a New Fed Chair, and the Dollar at Triple-Bottom SupportApril 2026 NFP forecast 62K–70K vs March 178K. Unemployment expected 4.3%. Fed on hold at 3.50–3.75% with Kevin Warsh as new chair. DXY triple-bottom at $97.69. Trade setup inside.The Apr
Author  TradingKey
May 08, Fri
April 2026 NFP forecast 62K–70K vs March 178K. Unemployment expected 4.3%. Fed on hold at 3.50–3.75% with Kevin Warsh as new chair. DXY triple-bottom at $97.69. Trade setup inside.The Apr
Related Instrument
goTop
quote