
GBP/USD slips as softer UK inflation boosts BoE dovish bets
- GBP/USD dives 0.21% to 1.3326 after UK inflation undershot both BoE and market forecasts.
- BoE rate-cut expectations rise — markets now price in 20 bps of easing for December, up from 11 bps.
- Dollar finds support amid trade tensions and haven demand; Gold rebounds over 1%.
The GBP/USD retreats on Thursday, down over 0.21% after the latest inflation report in the United Kingdom, increased the odds for a Bank of England rate cut by the end of the year. At the time of writing, the pair trades at 1.3326 after reaching a high of 1.3359.
Sterling weakens as traders turn cautious ahead of Friday’s key US CPI release
A scarce economic docket in the US and the UK keeps traders waiting for Friday’s Consumer Price Index (CPI) report in the US, with estimates of headline and core inflation, to be at around 3.1%. in the meantime, Existing Home Sales in the US grew 1.5% in August, compared to July’s -0.2% contraction. Sales rose by 4.06 million as expected up from 4 million.
The White House trade rhetoric on China, keeps investors anxious and turning to haven assets like the Dollar and Gold, which has recovered some ground, up over 1%. On Wednesday, Reuters sources revealed that the administration plan to restrict globally produced exports to China made with or containing US software, in retaliation to China’s exports controls on rare earths and port fees to US vessels.
Meanwhile, Washington and Beijing’s delegations will meet in a summit in Malaysia from October 24 to 27 ahead of the reunion between Trump and the Chinese President Xi Jinping.
In the UK, British inflation was steady in September, below both market estimates and the BoE’s forecast. Following the data release, Interest rate probabilities, showed an increase from 11 to 20 basis points of easing by the UK central bank at the December’s meeting.
Despite this, the interest rate differential between the US and Uk, favor further upside in the GBP/USD pair. Nevertheless, fiscal headwinds with UK’s finance minister Reeves announced the budget next month, is expected to include a combination of tax rises and spending cuts.
Nick Rees, head of macro research at Monex Europe commented that he expects Sterling’s weakness as the budget might not be well received.
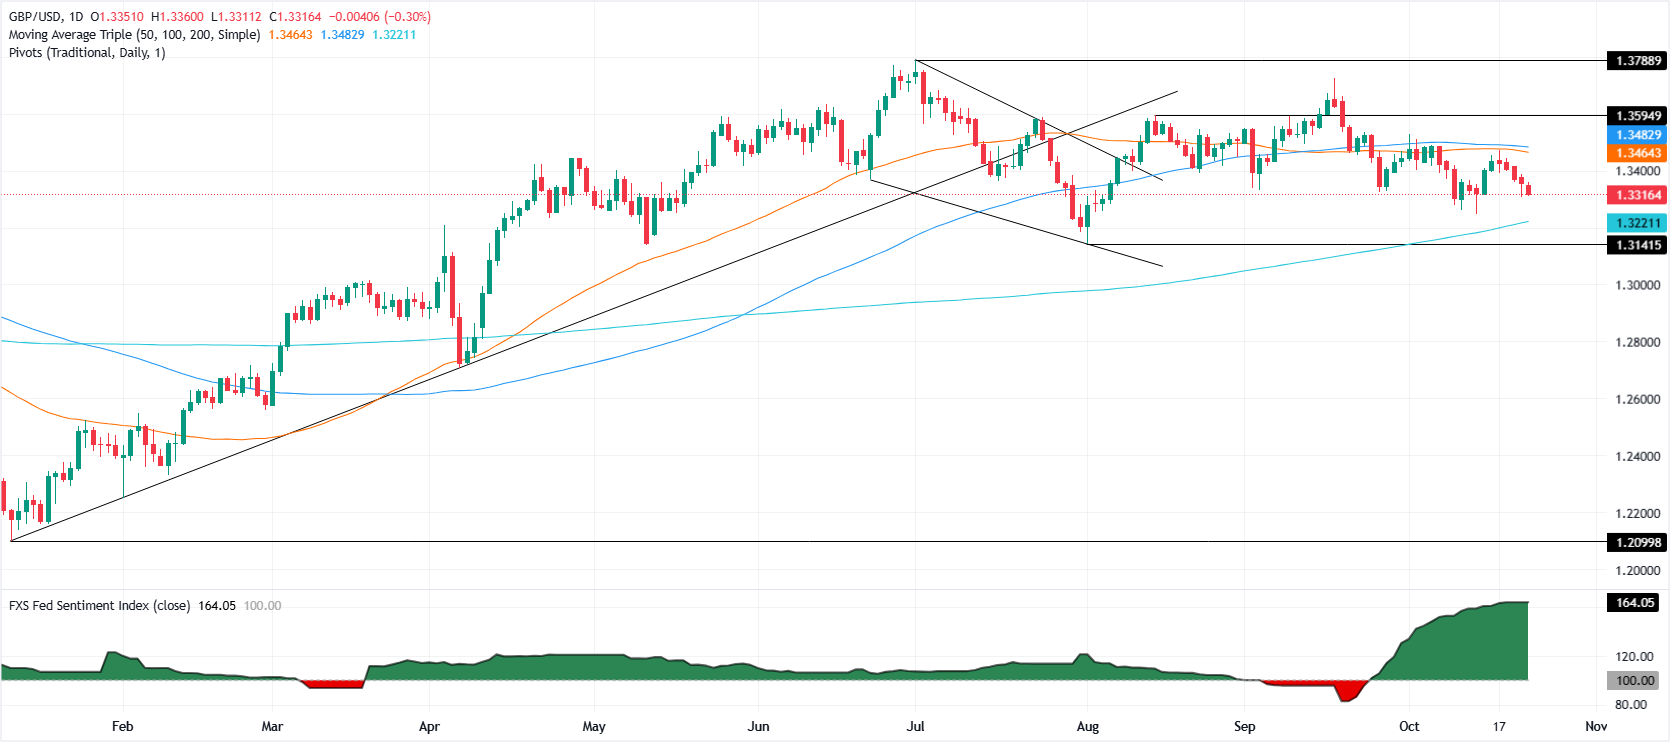
GBP/USD Price Forecast: Technical outlook
GBP/USD technical picture suggests that the ongoing pullback could extend below 1.3300, which clears the path to challenge October 14 low of 1.3248 ahead of the 200-day SMA at 1.3217. If those two levels are cleared, up next is 1.3200, followed by the August 1 swing low of 1.3141.
Conversely, if GBP/USD rises past 1.3400, buyers will face key resistance levels like the 50-day SMA and the 100-day SMA, each at 1.3461 and 1.3479, respectively.
Pound Sterling Price This week
The table below shows the percentage change of British Pound (GBP) against listed major currencies this week. British Pound was the strongest against the Japanese Yen.
| USD | EUR | GBP | JPY | CAD | AUD | NZD | CHF | |
|---|---|---|---|---|---|---|---|---|
| USD | 0.49% | 0.87% | 1.44% | -0.13% | -0.31% | -0.19% | 0.48% | |
| EUR | -0.49% | 0.38% | 1.01% | -0.62% | -0.70% | -0.75% | 0.00% | |
| GBP | -0.87% | -0.38% | 0.37% | -0.99% | -1.07% | -1.12% | -0.39% | |
| JPY | -1.44% | -1.01% | -0.37% | -1.60% | -1.75% | -1.68% | -1.03% | |
| CAD | 0.13% | 0.62% | 0.99% | 1.60% | -0.13% | -0.13% | 0.61% | |
| AUD | 0.31% | 0.70% | 1.07% | 1.75% | 0.13% | -0.05% | 0.69% | |
| NZD | 0.19% | 0.75% | 1.12% | 1.68% | 0.13% | 0.05% | 0.74% | |
| CHF | -0.48% | -0.00% | 0.39% | 1.03% | -0.61% | -0.69% | -0.74% |
The heat map shows percentage changes of major currencies against each other. The base currency is picked from the left column, while the quote currency is picked from the top row. For example, if you pick the British Pound from the left column and move along the horizontal line to the US Dollar, the percentage change displayed in the box will represent GBP (base)/USD (quote).
Recommended Articles


