USD/JPY Price Analysis: Hold steady below 152.00 amid intervention threats

Source Fxstreet
  • USD/JPY is modestly up, reflecting a cautious market amidst higher US Treasury yields and potential for Japanese intervention.
  • Technical indicators suggest resistance at 152.00, with further targets at 153.00 and 155.00 should the major break higher.
  • A move below the Tenkan-Sen could see USD/JPY testing support levels down to 148.93, amid ongoing market vigilance.

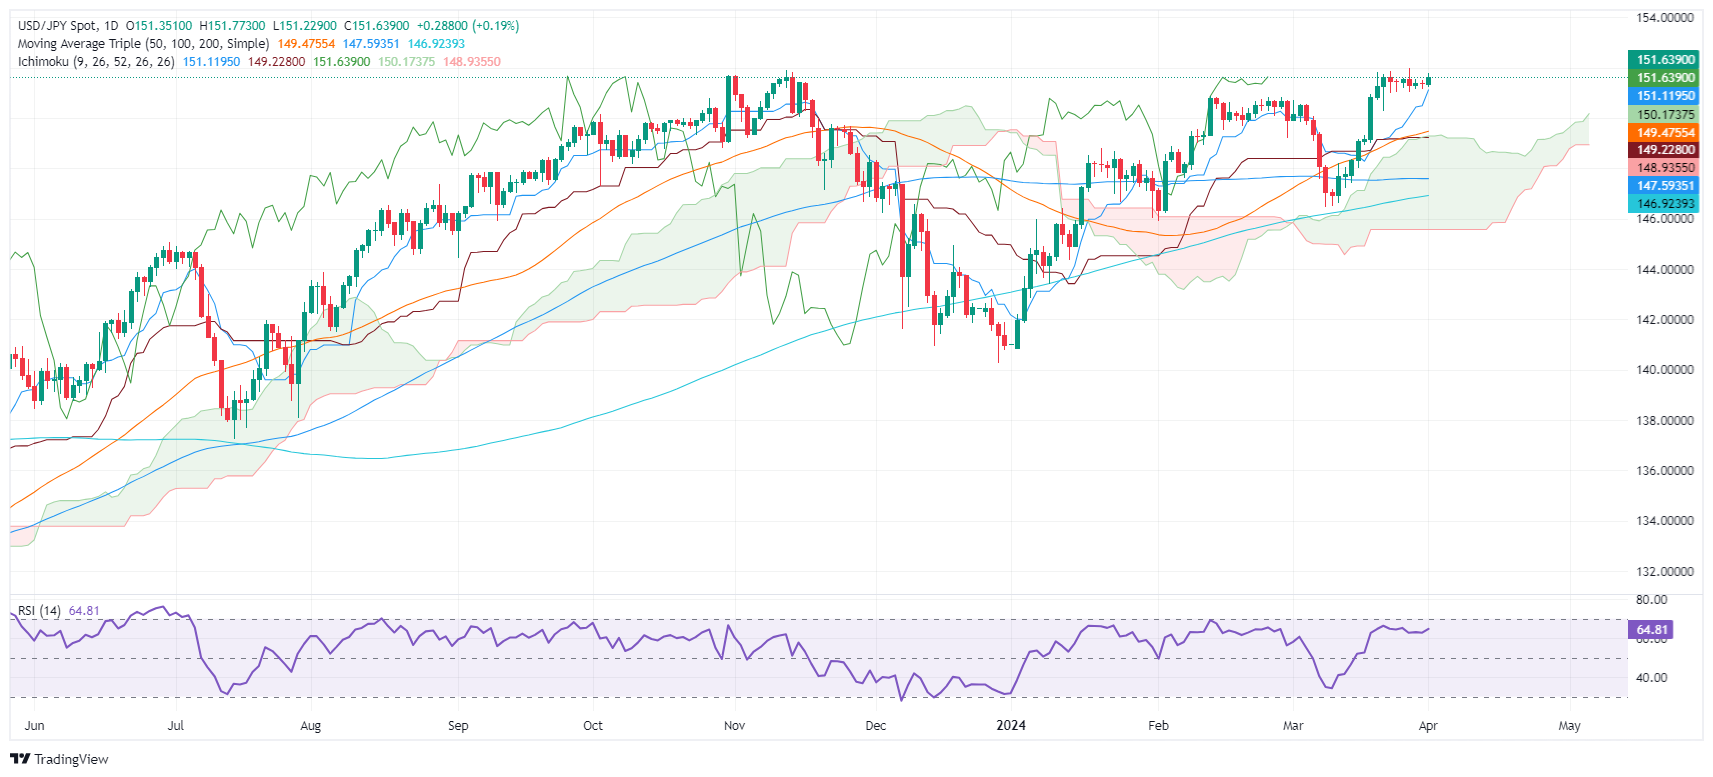
The USD/JPY remains subdued amid speculation of possible intervention by Japanese authorities. Although US Treasury yields pushed higher during Monday’s session, with the 10-year benchmark note rate rising 11 basis points, the pair stood shy of the day’s high of 151.77. At the time of writing, the major trades at 151.63, up 0.15%.

USD/JPY Price Analysis: Technical outlook

The USD/JPY daily chart depicts the pair consolidating around the 151.00/152.00 region, with intervention threats strengthening the 152.00 mark as a first resistance level. A breach of the latter will expose the 153.00 psychological figure, ahead of 155.00.

On the other hand, if the USD/JPY pulls back below the Tenkan-Sen at 151.12, that would send the pair sliding to the Senkou Span A at 150.17, followed by the Kijun-Sen at 149.22. Further downside is seen at the Senkou Span B at 148.93.

USD/JPY Price Action – Daily Chart\

USD/JPY

Overview
Today last price 151.63
Today Daily Change 0.28
Today Daily Change % 0.19
Today daily open 151.35
 
Trends
Daily SMA20 149.8
Daily SMA50 149.4
Daily SMA100 147.59
Daily SMA200 146.88
 
Levels
Previous Daily High 151.5
Previous Daily Low 151.17
Previous Weekly High 151.97
Previous Weekly Low 151.03
Previous Monthly High 151.97
Previous Monthly Low 146.48
Daily Fibonacci 38.2% 151.3
Daily Fibonacci 61.8% 151.38
Daily Pivot Point S1 151.18
Daily Pivot Point S2 151.01
Daily Pivot Point S3 150.86
Daily Pivot Point R1 151.51
Daily Pivot Point R2 151.67
Daily Pivot Point R3 151.84


Disclaimer: For information purposes only. Past performance is not indicative of future results.
placeholder
Bulls Rout. Bitcoin Slumps Over 16% in a Week to Hit Bottom, Cryptocurrency Market Faces "Serial Liquidations"During the Asian trading session on June 5, Bitcoin extended its recent slump, falling more than 3.5% within 24 hours. It briefly broke below $62,000, hitting a low of $61,100, bringing i
Author  TradingKey
Yesterday 10: 01
During the Asian trading session on June 5, Bitcoin extended its recent slump, falling more than 3.5% within 24 hours. It briefly broke below $62,000, hitting a low of $61,100, bringing i
placeholder
Gold declines below $4,500 on stalled US-Iran ceasefire talks, US NFP data loomsGold price (XAU/USD) edges lower to near $4,470 during the early Asian session on Friday. The precious metal remains volatile amid ongoing geopolitical turmoil. Traders will closely monitor the developments surrounding the US-Iran peace deal and the US May employment report later on Friday. 
Author  FXStreet
Yesterday 01: 25
Gold price (XAU/USD) edges lower to near $4,470 during the early Asian session on Friday. The precious metal remains volatile amid ongoing geopolitical turmoil. Traders will closely monitor the developments surrounding the US-Iran peace deal and the US May employment report later on Friday. 
placeholder
Bitcoin Suffers Year’s Strongest Waterfall-Style Decline. Will It Next Drop to the $60,000 Mark?During the Asian trading session on June 4, Bitcoin continued its multi-day slump, briefly dropping below the $62,000 mark to $61,338. As of press time, Bitcoin was trading at $63,844, wi
Author  TradingKey
Jun 04, Thu
During the Asian trading session on June 4, Bitcoin continued its multi-day slump, briefly dropping below the $62,000 mark to $61,338. As of press time, Bitcoin was trading at $63,844, wi
placeholder
Bitcoin drops below $65K amid reinforced bear market signalsBitcoin (BTC) dipped further below $65,000 on Wednesday, with onchain data from Glassnode signaling a market firmly in a bear phase. The decline has pushed prices back into a key valuation range between the Realized Price and the True Market Mean.
Author  FXStreet
Jun 04, Thu
Bitcoin (BTC) dipped further below $65,000 on Wednesday, with onchain data from Glassnode signaling a market firmly in a bear phase. The decline has pushed prices back into a key valuation range between the Realized Price and the True Market Mean.
placeholder
Forex Today: US Dollar stays resilient ahead of key US dataHere is what you need to know on Wednesday, June 3:
Author  FXStreet
Jun 03, Wed
Here is what you need to know on Wednesday, June 3:
Related Instrument
goTop
quote