EUR/JPY Price Analysis: Wave C of a bearish Measured Move unfolds

Source Fxstreet
  • EUR/JPY continues declining and has formed a bearish pattern called a Measured Move. 
  • It is composed of three waves – wave C appears to be in mid development.
  • The bearish 4-hour chart echoes weak technicals observed on the weekly chart.  

EUR/JPY is down over a third of a percent, trading in the 163.70s on Wednesday, on the back of a mixture of probable intervention by the Japanese authorities to strengthen the Japanese Yen (JPY) and more dovish commentary from rate-setters at the European Central Bank (ECB).  

The 4-hour chart is showing a bearish ABC Measured Move pattern forming which looks like it probably still has lower to go. 
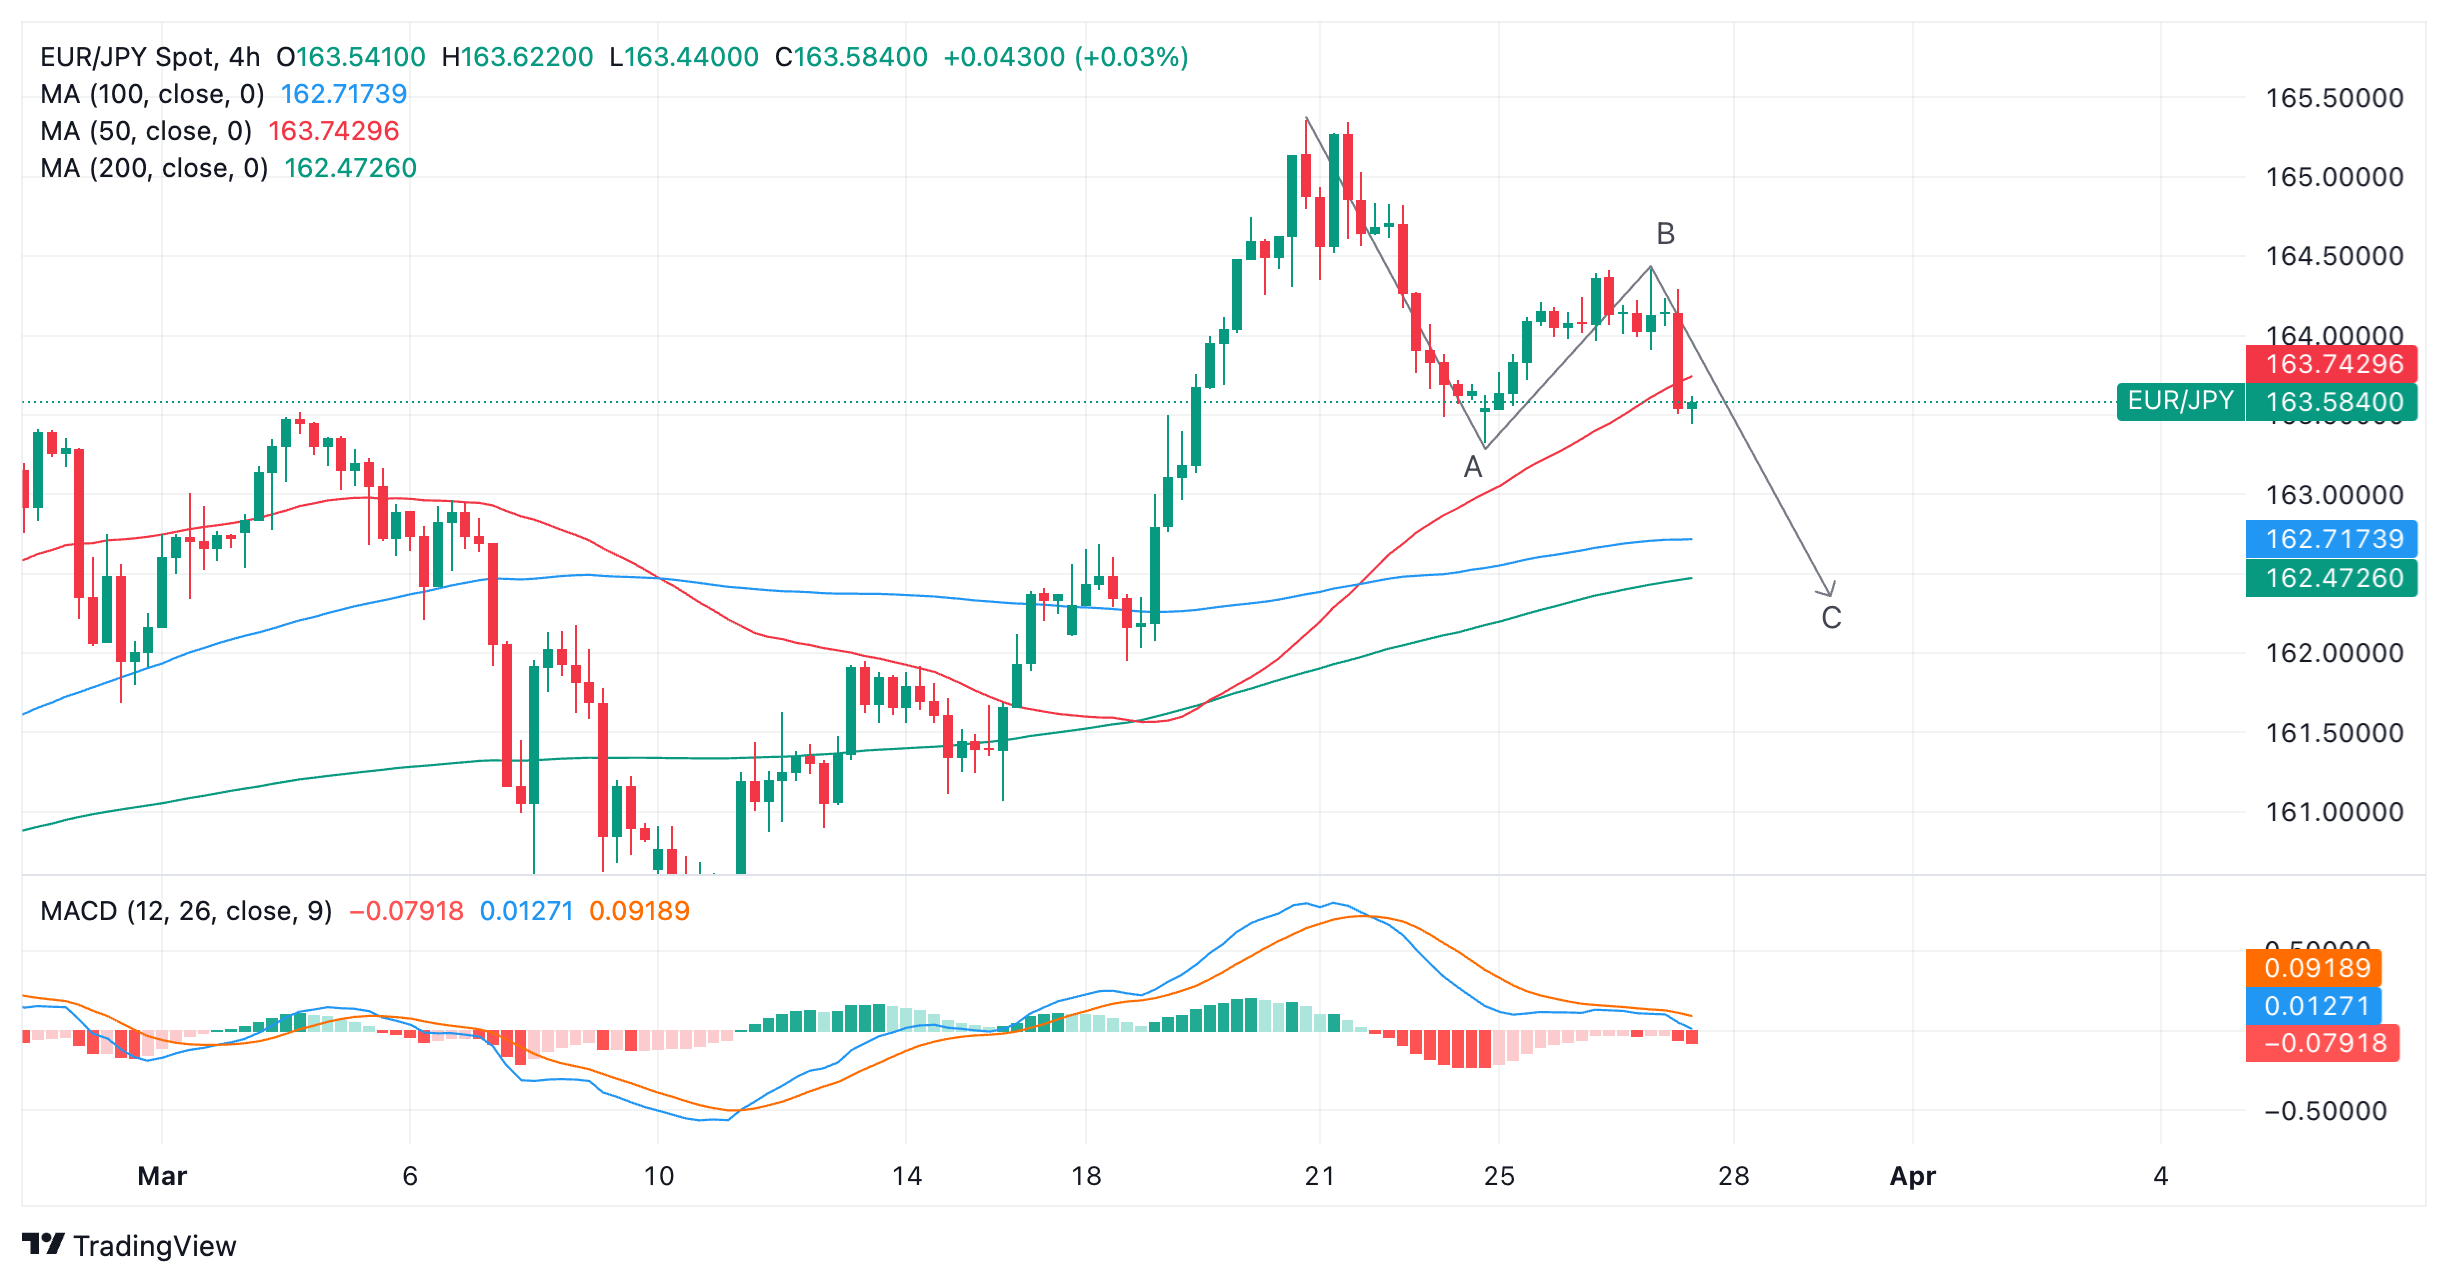
Euro versus Japanese Yen: 4-hour chart

If wave C is the same length as wave A, which is often the case, the Measured Move could stretch down to a target situated at about 162.40, just below the 200-4hr Simple Moving Average (SMA). 

The pair has just completed a long red bearish Marubozu Japanese candlestick pattern which adds a further bearish tone to the chart. Even if there is a pullback after the sell-off it will probably only go as high as the midpoint of the Marubozu candle at 163.90 before probably continuing lower. 

The short-term trend remains unclear but a break below the lows of wave A at 163.32 would provide confirmation shifting the odds in favor of a downtrend and a continuation of wave C. 

The acute bearish divergence with the Relative Strength Indicator (RSI) on the Weekly chart as reported in a previous article, is further evidence supporting more downside.

Disclaimer: For information purposes only. Past performance is not indicative of future results.
placeholder
Natural Gas sinks to pivotal level as China’s demand slumpsNatural Gas price (XNG/USD) edges lower and sinks to $2.56 on Monday, extending its losing streak for the fifth day in a row. The move comes on the back of China cutting its Liquified Natural Gas (LNG) imports after prices rose above $3.0 in June. It
Author  FXStreet
Jul 01, 2024
Natural Gas price (XNG/USD) edges lower and sinks to $2.56 on Monday, extending its losing streak for the fifth day in a row. The move comes on the back of China cutting its Liquified Natural Gas (LNG) imports after prices rose above $3.0 in June. It
placeholder
Bitcoin ETF Inflows For 2025 Now Outpace 2024, Data ShowsUS Bitcoin spot exchange-traded funds (ETFs) have seen more inflows this year so far compared to the same point in 2024, according to data.
Author  Bitcoinist
Jul 16, Wed
US Bitcoin spot exchange-traded funds (ETFs) have seen more inflows this year so far compared to the same point in 2024, according to data.
placeholder
On-chain data showed that whales are aggressively accumulating more Bitcoin and EthereumOn-chain data showed that whales are aggressively accumulating more Bitcoin and Ethereum.
Author  Cryptopolitan
Jul 30, Wed
On-chain data showed that whales are aggressively accumulating more Bitcoin and Ethereum.
placeholder
Nvidia becomes biggest single-stock weight in S&P 500 historyNvidia now holds more than 8% of the S&P 500, the largest weight for any one stock in the index since records began in 1981.
Author  Cryptopolitan
Aug 13, Wed
Nvidia now holds more than 8% of the S&P 500, the largest weight for any one stock in the index since records began in 1981.
placeholder
Gold Price Forecast: XAU/USD gains momentum to near $3,650, eyes on US CPI releaseThe Gold price (XAU/USD) gains momentum to near $3,645 during the early Asian session on Thursday.
Author  FXStreet
Sep 11, Thu
The Gold price (XAU/USD) gains momentum to near $3,645 during the early Asian session on Thursday.
Related Instrument
goTop
quote