USD/JPY Price Analysis: Possibility of Key Reversal Day forming

Source Fxstreet
  • USD/JPY could be forming a bearish Key Reversal Day. 
  • A bearish close on Wednesday will validate the one-day pattern. 
  • It often signifies major peaks and occurred at the highs of the stock market in 2007 prior to the crisis. 

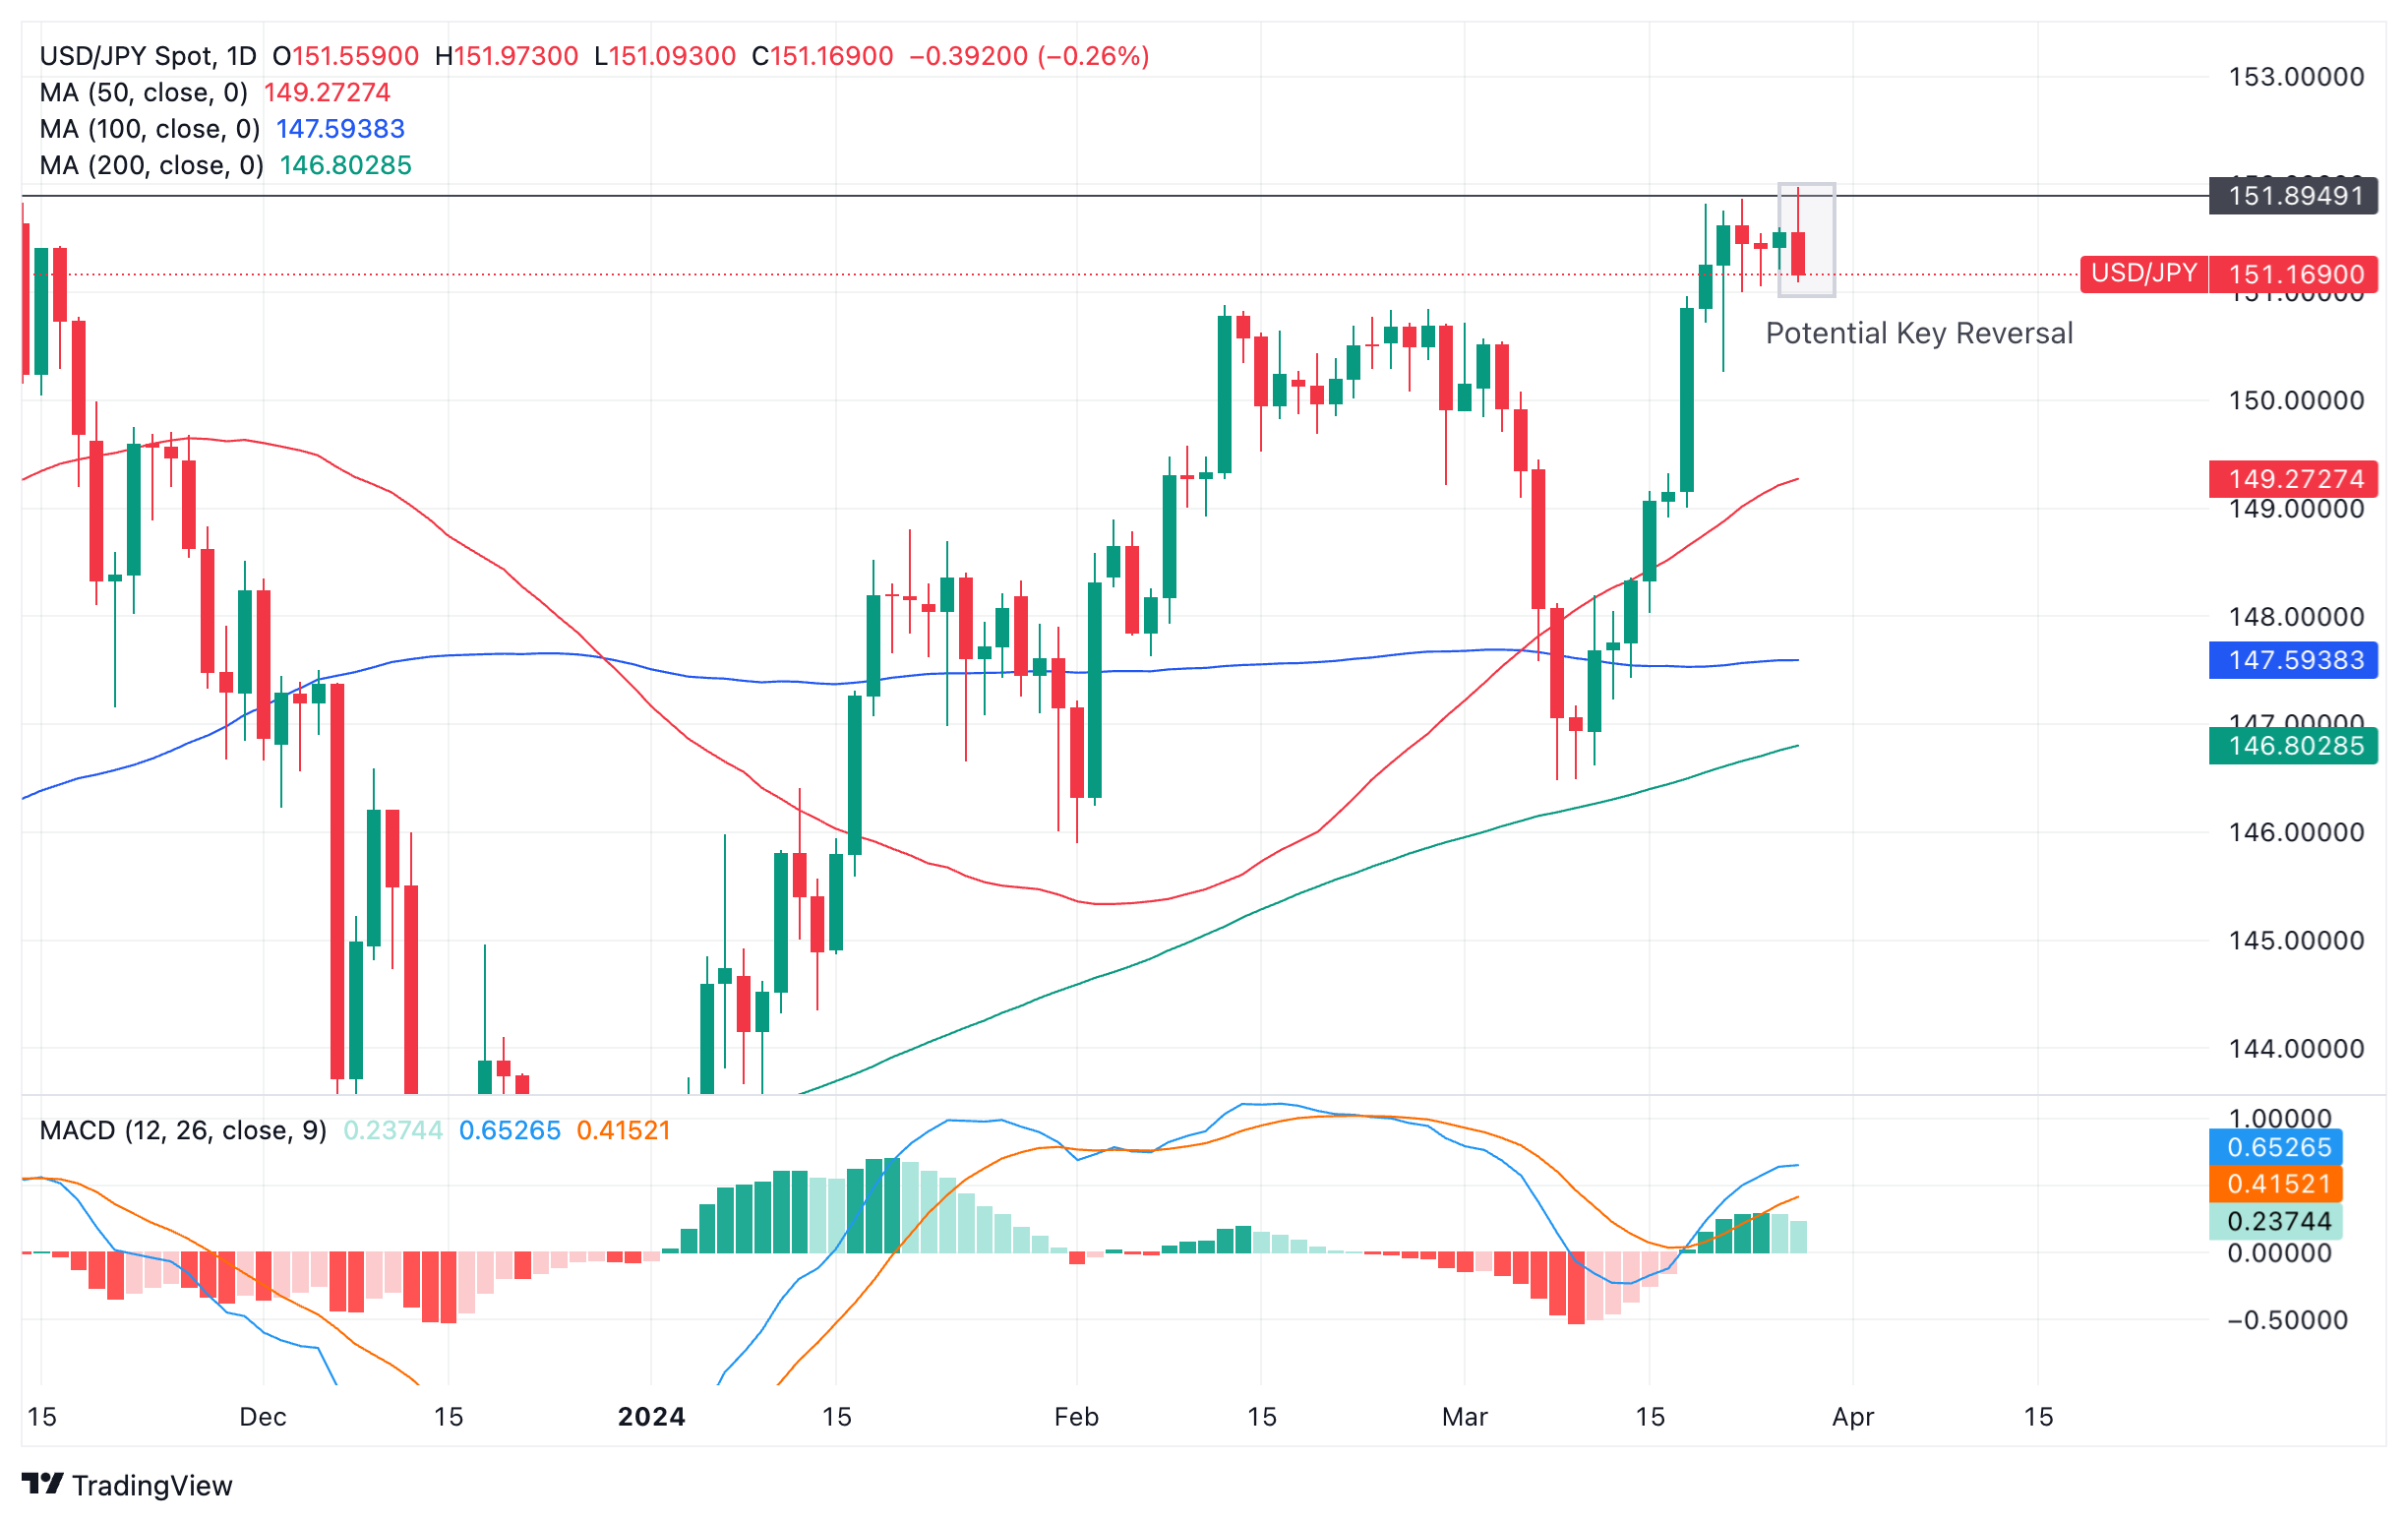
USD/JPY is trading back in the lower 151.000s on Wednesday after rising up to a new high of 151.970 during the Asian session, its highest level for decades. 

The rapid reversal has been put down to intervention by the Japanese authorities who do not wish to see the Japanese Yen (JPY) depreciate any further. 

Such a strong reversal over the course of one day has a special term in technical analysis – it is called a “Key Reversal Day”. 

Key Reversal Days are a sign a major reversal in price is on the horizon. It is defined as a day in which price rises up to a new long-term high before rolling over and closing below the low of the previous day (rectangled). The sudden shift in sentiment is indicative of a sea-change in the fundamental outlook for the asset’s price.  
US Dollar versus Japanese Yen: Daily chart

If USD/JPY can maintain its current losses until the end of the day on Wednesday, it will have achieved a Key Reversal Day and may be in line for more losses to come. If it fails to close below Tuesday’s lows at 151.207 it will fail to meet the criteria for a key reversal. 

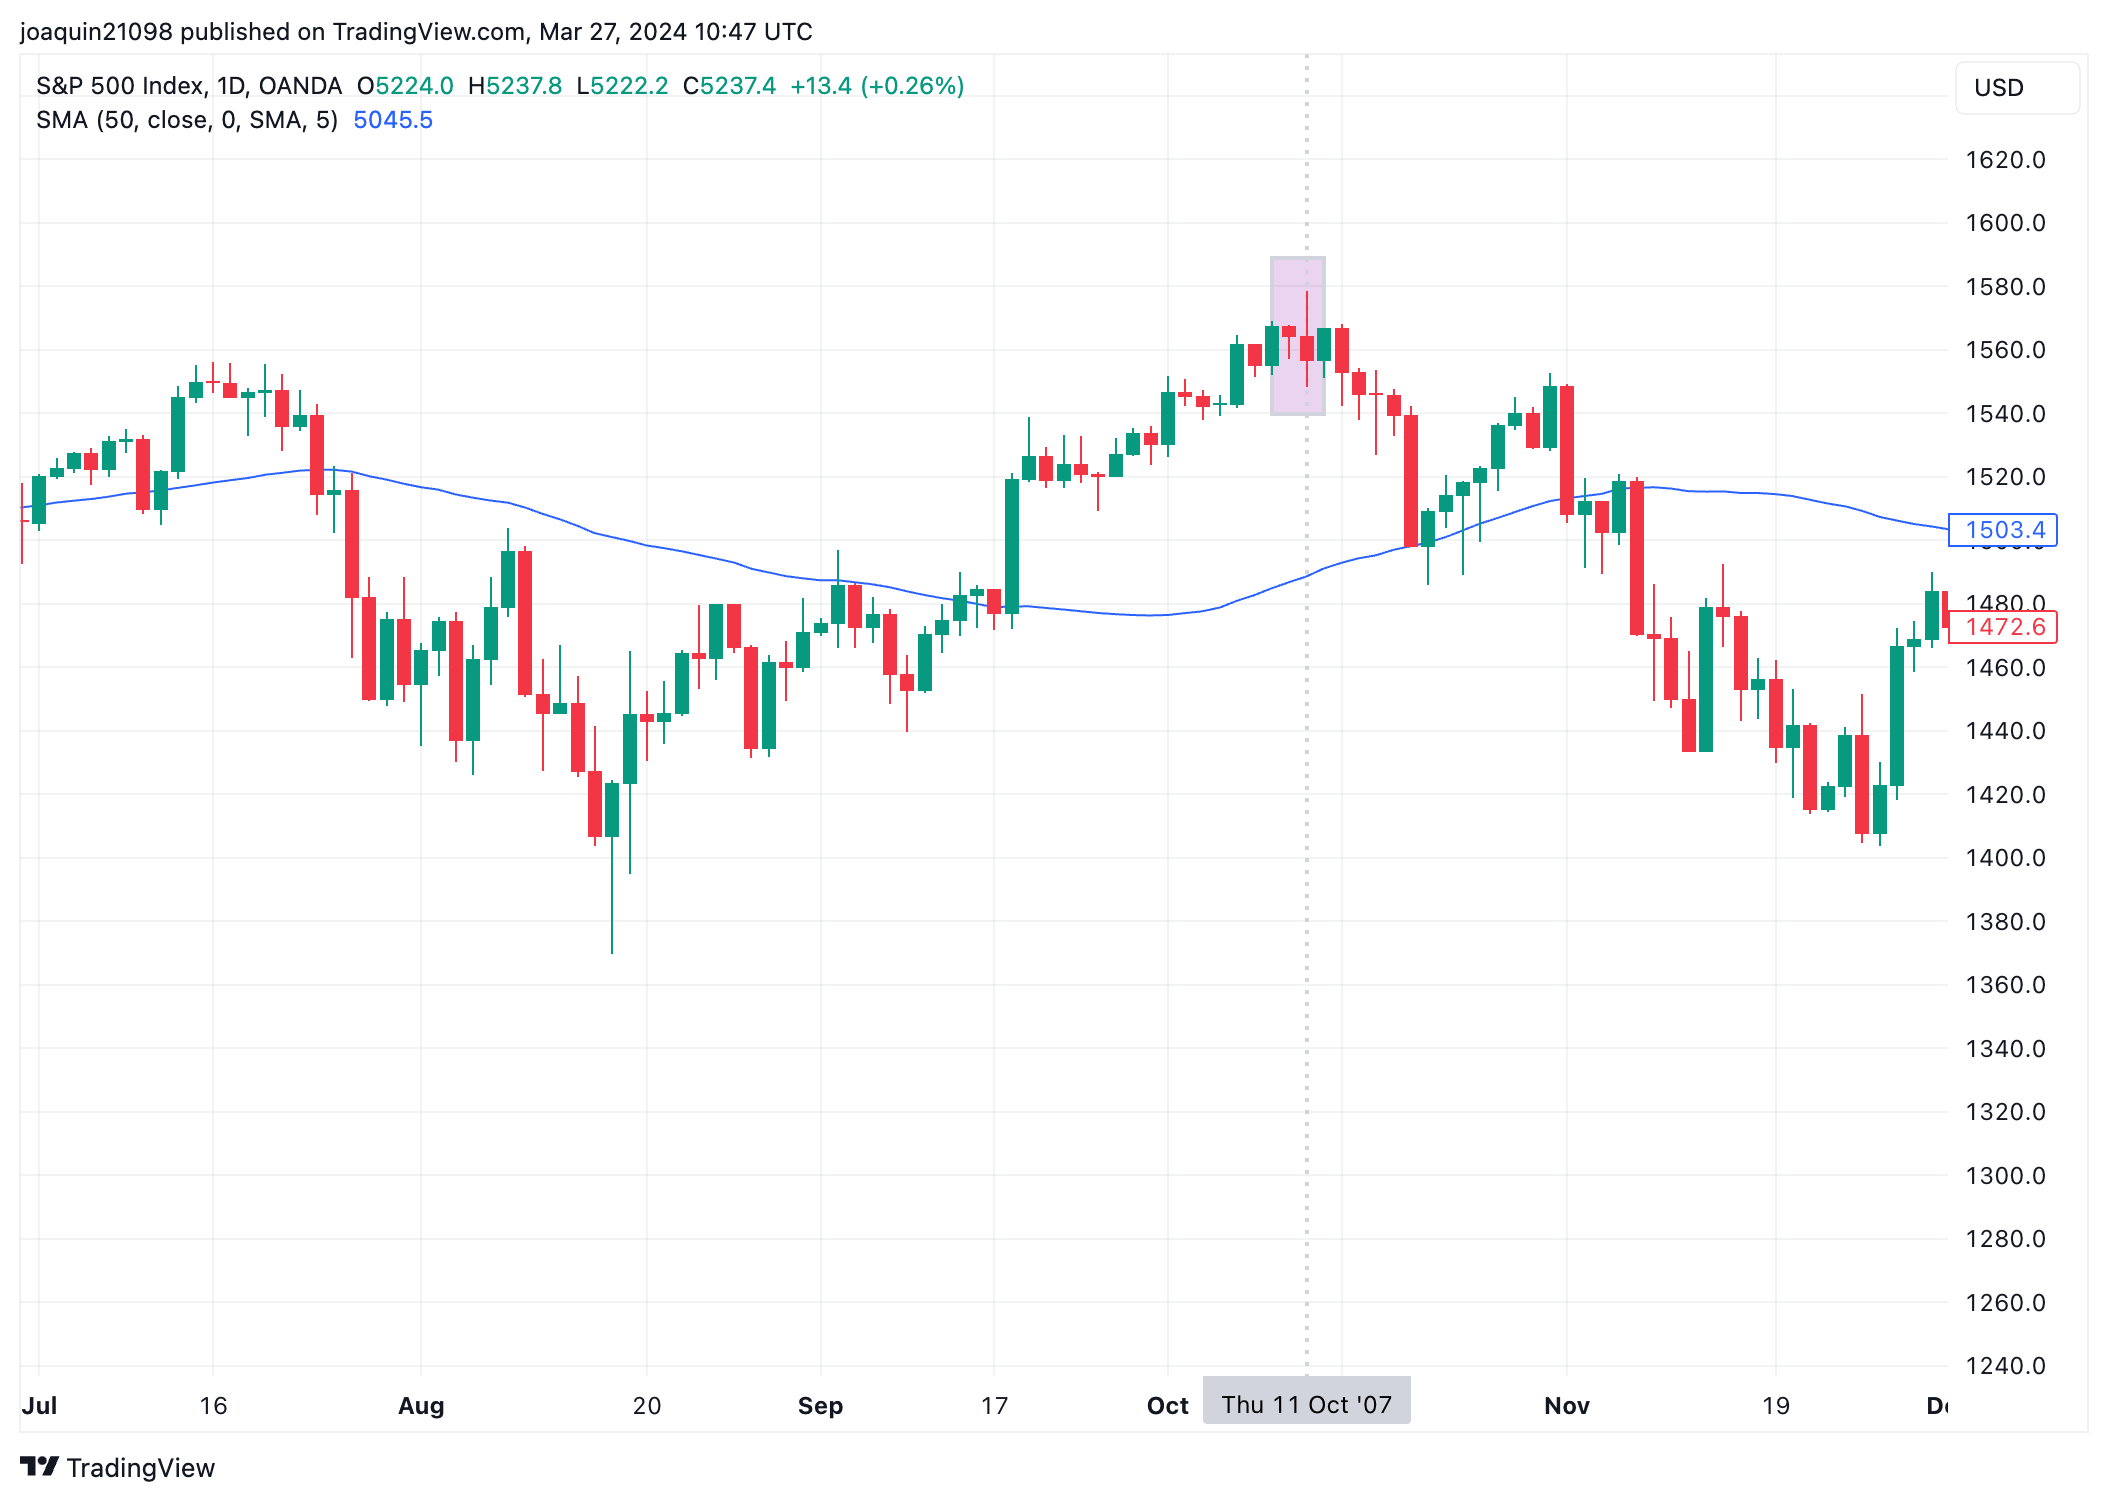
A Key Reversal happened on the S&P 500 index on October 11, 2007 at the peak of the stock market rally just prior to the Great Financial Crisis. 

It marked the peak price the S&P 500 achieved before the bear market that followed the banking crisis. 
S&P500: Daily chart 

Although this subtle though important clue of future weakness largely went unnoticed by most investors, a few technical analysts brought it to attention at the time!


Disclaimer: For information purposes only. Past performance is not indicative of future results.
placeholder
Bitcoin volatility drops to third-lowest level since 2012 amid rise in BTC treasury companiesBitcoin (BTC) trades above $108,000 on Tuesday following a steady decline in its volatility in the first half of the year, marking the third-lowest H1 volatility since 2012.
Author  FXStreet
Yesterday 02: 11
Bitcoin (BTC) trades above $108,000 on Tuesday following a steady decline in its volatility in the first half of the year, marking the third-lowest H1 volatility since 2012.
placeholder
AUD/NZD inches higher to near 1.0900 as RBNZ maintains Official Cash Rate at 3.25%AUD/NZD holds ground after the Reserve Bank of New Zealand (RBNZ) decided to stand pat on the policy rate after six consecutive cuts, trading around 1.0890 during the Asian hours on Wednesday.
Author  FXStreet
Yesterday 03: 03
AUD/NZD holds ground after the Reserve Bank of New Zealand (RBNZ) decided to stand pat on the policy rate after six consecutive cuts, trading around 1.0890 during the Asian hours on Wednesday.
placeholder
Ethereum Price Turns Positive — More Upside Likely if Momentum HoldsETH is now consolidating gains and might aim for a fresh move above $2,620.
Author  NewsBTC
Yesterday 03: 26
ETH is now consolidating gains and might aim for a fresh move above $2,620.
placeholder
Jeff Bezos sold nearly 3 million Amazon shares for $665.8 million in early JulyJeff Bezos has sold nearly three million shares of Amazon in the first two days of July, offloading a total of $665.8 million.
Author  Cryptopolitan
Yesterday 03: 43
Jeff Bezos has sold nearly three million shares of Amazon in the first two days of July, offloading a total of $665.8 million.
placeholder
Gold price slides further below $3,300, over one-week low amid a firmer USDGold price (XAU/USD) trades with a negative bias below the $3,300 mark during the Asian session on Wednesday and drops to a one-and-a-half-week low in the last week.
Author  FXStreet
22 hours ago
Gold price (XAU/USD) trades with a negative bias below the $3,300 mark during the Asian session on Wednesday and drops to a one-and-a-half-week low in the last week.
Related Instrument
goTop
quote