

Ge Vernova Inc Stock (GEV) Moved Down by 3.22% on Mar 13: Facts Behind the Movement
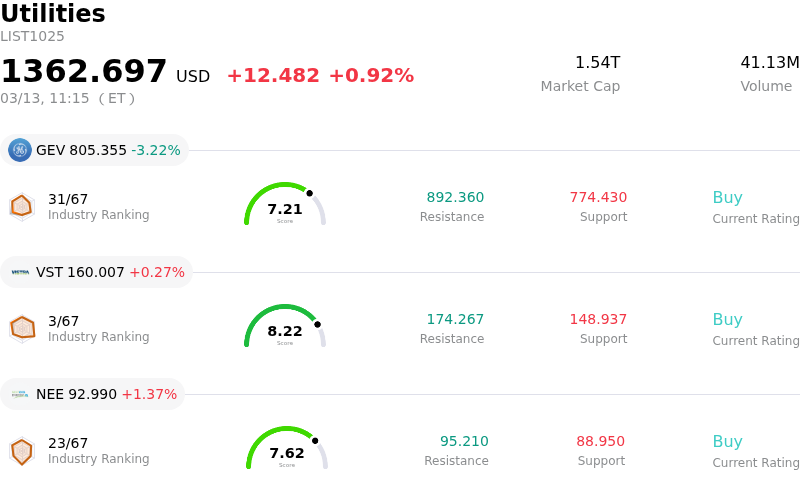
Ge Vernova Inc (GEV) moved down by 3.22%. The Utilities sector is up by 0.92%. The company underperformed the industry. Top 3 stocks by turnover in the sector: Ge Vernova Inc (GEV) down 3.22%; Vistra Corp (VST) up 0.27%; Nextera Energy Inc (NEE) up 1.37%.
What is driving Ge Vernova Inc (GEV)’s stock price down today?
GEV experienced downward pressure today, indicating significant intraday volatility. This movement appears to be primarily influenced by a broader negative shift in market sentiment. The overall U.S. stock market is reportedly undergoing a challenging session, driven by macroeconomic concerns such as escalating geopolitical tensions and a deteriorating domestic economic outlook. This widespread market weakness is likely contributing to the decline in individual stock prices, including GEV.
Further contributing to the negative sentiment, several institutional investors have recently reported adjustments to their holdings in GEV. While these reports reflect activity from prior quarters, their dissemination today could impact current trading decisions. For instance, Entropy Technologies LP significantly reduced its stake in GEV, and 11 Capital Partners LP also lowered its holdings. Additionally, The Free Markets ETF fully exited its position in the company. Such institutional divestments, even if historical, can signal a cautious stance and trigger further selling by other market participants.
Beyond broader market dynamics and institutional adjustments, some company-specific factors may amplify GEV's sensitivity during a downturn. The company's wind segment continues to face challenges and is projected to incur losses in 2026. Concerns regarding the stock's valuation, which some analysts describe as rich or "priced for perfection," may also make it more susceptible to corrections when market sentiment sours. While there has been recent positive news for GEV, including strong financial results, increased guidance, and analyst upgrades in recent days, these positive developments appear to be overshadowed by the prevailing macroeconomic headwinds and investor caution today.
Technical Analysis of Ge Vernova Inc (GEV)
Technically, Ge Vernova Inc (GEV) shows a MACD (12,26,9) value of [28.86], indicating a neutral signal. The RSI at 54.74 suggests neutral condition and the Williams %R at -53.27 suggests oversold condition. Please monitor closely.
Fundamental Analysis of Ge Vernova Inc (GEV)
Ge Vernova Inc (GEV) is in the Utilities industry. Its latest annual revenue is $38.07B, ranking 2 in the industry. The net profit is $4.88B, ranking 3 in the industry. Company Profile
Over the past month, multiple analysts have rated the company as Buy, with an average price target of $865.83, a high of $1100.00, and a low of $424.45.
More details about Ge Vernova Inc (GEV)
Company Specific Risks:
- The Wind segment is projected to incur a $400 million EBITDA loss in 2026 and faces ongoing execution challenges, including a "stop work order" for the Vineyard Wind project that could prevent billing on $250 million of revenue.
- The stock is considered richly valued by analysts at 60x forward earnings or "priced for perfection" (72.81x EV/aEBITDA), increasing its susceptibility to significant downward corrections should it fail to meet ambitious growth or margin targets.
- The company's reliance on complex global supply networks and exposure to raw material disruptions, logistical delays, and tariffs continues to adversely impact production timelines and raise input costs.
- A current ratio of 0.98 and quick ratio of 0.75 indicate potential liquidity constraints and challenges in short-term financial flexibility.
Recommended Articles


