

USD/CAD Price Forecast: First downside target emerges near 1.4150, eyes on Canadian CPI inflation data

- Gold Price Forecast: Gold Poised to Break $4,200 as Oil Price Slump Eases Inflation Fears
- Gold Price Forecast: Oil Price Breaking $100 Fuels Inflation Concerns, Will Gold Prices Fall Further?
- Gold Price Trend Forecast: Expectations of Easing US-Iran Tensions Boost Gold Prices, $4,070 Becomes Key Level for Bulls and Bears
- Gold rallies to over two-week high, eyes $4,150 as traders track US-Iran diplomacy efforts
- Middle East War updates: US-Iran pause strikes as Trump weighs up diplomatic options
- Euro declines to near 1.1400 as US launches fresh strikes on Iran

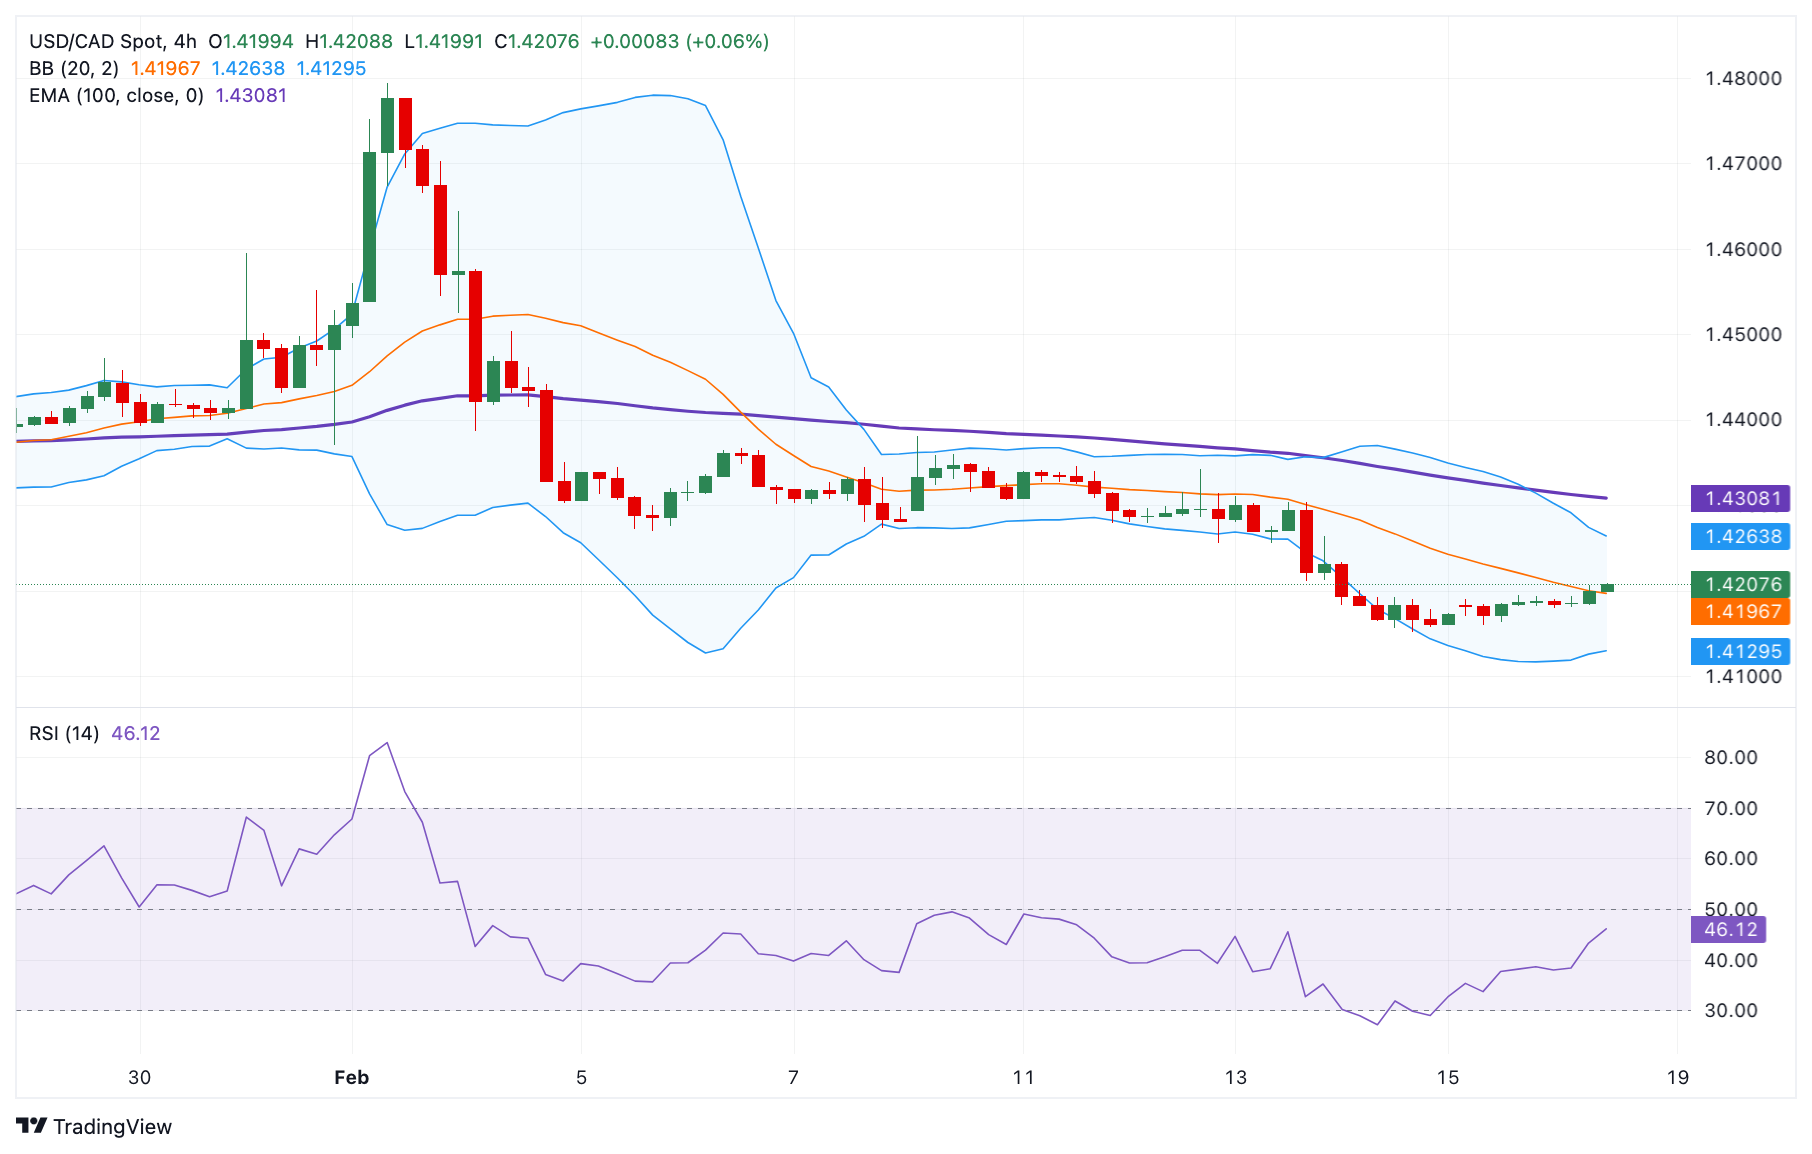
USD/CAD gathers strength to around 1.4205 in Tuesday’s early European session.
The pair keeps the negative view below the 100-period EMA with the bearish RSI indicator.
The first downside target to watch is 1.4151; the immediate resistance level emerges near 1.4265.
The USD/CAD pair trades in positive territory near 1.4205 during the early European session on Tuesday, supported by the firmer Greenback. The Canadian Consumer Price Index (CPI) inflation data for January will be the highlight later on Tuesday.
The headline CPI is estimated to show an increase of 1.8% YoY in January. On a monthly basis, the CPI inflation is projected to rise to 0.1% in January from a decline of 0.4% in December.
According to the 4-hour chart, the bearish outlook of USD/CAD prevails as the pair is below the key 100-period Exponential Moving Average (EMA). The downward momentum is reinforced by the Relative Strength Index (RSI), which stands below the midline near 46.25, supporting the sellers in the near term.
The initial support level for the cross is seen at 1.4151, the low of February 14. Any follow-through selling below the mentioned level could see a drop to 1.4130, the lower limit of the Bollinger Band. Further south, the next contention level to watch is the 1.4100 psychological level.
The first upside barrier for the pair emerges near 1.4265, the upper boundary of the Bollinger Band. A decisive break above this level could pave the way to 1.4310, the 100-period EMA. Extended gains could see a rally to the next hurdle at 1.4380, the high of February 10.
USD/CAD 4-hour chart
Read more
* The content presented above, whether from a third party or not, is considered as general advice only. This article should not be construed as containing investment advice, investment recommendations, an offer of or solicitation for any transactions in financial instruments.


