

How will the US July retail sales impact the stock market and the US dollar?

- Bitcoin Suffers Year’s Strongest Waterfall-Style Decline. Will It Next Drop to the $60,000 Mark?
- Bitcoin drops below $65K amid reinforced bear market signals
- Forex Today: US Dollar stays resilient ahead of key US data
- $1.5 Billion in Crypto Assets Liquidated, Bitcoin Falls Below $66,000 Mark. What Is the Reason?

Main content:
On August 15th, the United States will release retail sales data for July. The market expects a month-on-month increase of 0.4% in retail sales, while the control group rate used to calculate GDP is expected to be 0.5%. If it meets or exceeds expectations, it will be positive for US stocks and the US dollar. Conversely, if the data falls below expectations, it will be negative for US stocks and the US dollar.
1.What are the market expectations for the upcoming release of July retail sales data in the United States?
On August 15th, the United States will release retail sales data for July. Market expectations suggest that the month-on-month retail sales rate for July, excluding automobiles, is expected to rise from 0.2% in June to 0.4%. Additionally, the control group retail sales used in GDP calculations (excluding automobiles, gasoline, building materials, and food services) is expected to be 0.5%, compared to 0.6% in June.
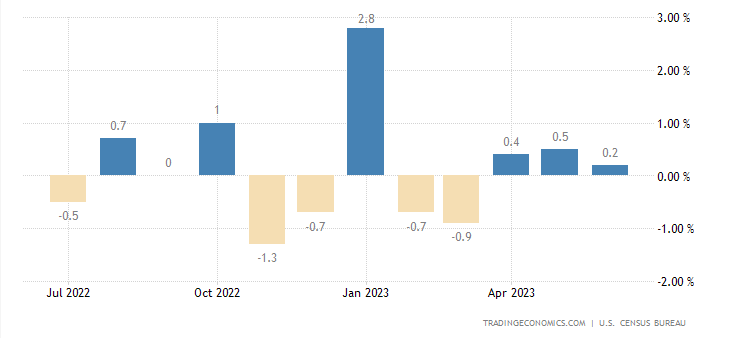
【Source:Trading economics】
However, different institutions have varying expectations regarding this matter. We have compiled the estimates from all parties as follows:
2.What impact does the July retail sales data have on US stocks and the US dollar?
As consumption accounts for nearly 70% of the US GDP, with retail sales representing close to 40% of consumer spending, observing US retail sales data can provide insight into the state of the consumer market and overall economic health of the United States.
US shares
In general, strong retail sales data indicates a healthy US economy, which is positive for the stock market. Conversely, weak retail sales data suggests a sluggish consumer market and a weaker US economy, which is negative for the stock market.
However, due to the ongoing process of the Federal Reserve raising interest rates, the impact of retail sales data has become more complex. For example, if retail sales are slightly lower than expected, signaling a slowdown in demand, it can be beneficial for decreasing inflation, thereby reducing the probability of a Federal Reserve interest rate hike. This, in turn, becomes a positive factor for the stock market.
Therefore, it is better to use retail sales data as an observation signal for the retail sales industry rather than as a judgment of the overall impact on the US stock market.
Since the end of May, the strong performance of retail sales has supported the optimistic view that Americans are still willing to spend, with the S&P Retail Select Industry Index rising by 16%, more than twice the 6.8% increase of the S&P 500 Index.
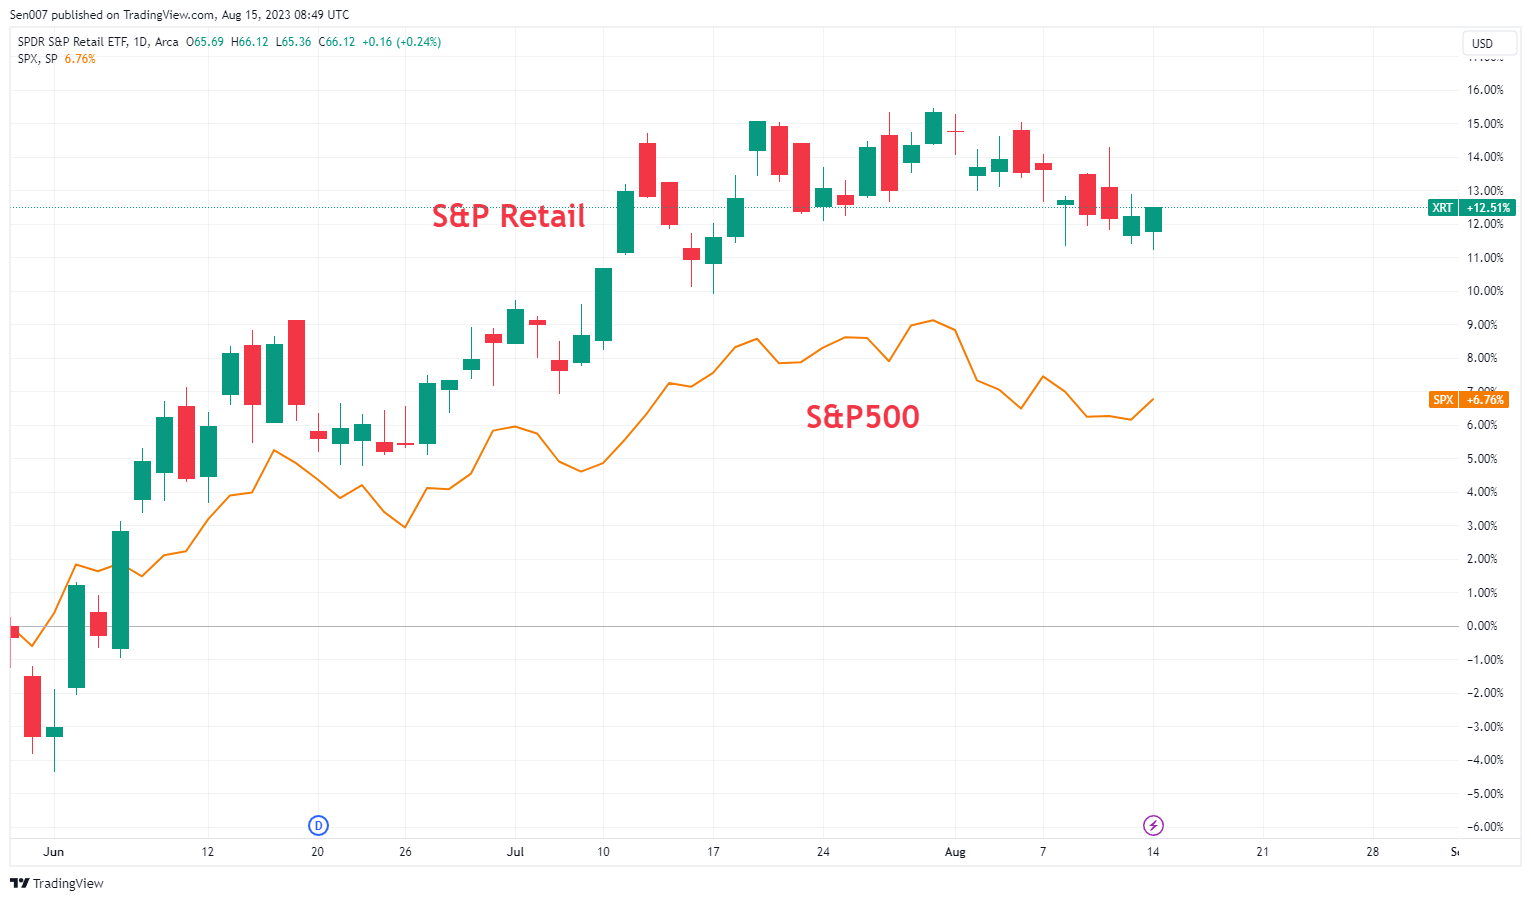
【Source:TradingView】
Since then, Home Depot has surged over 15%, Walmart's stock price has increased by 9%, and other retail stocks have also performed well. If this strong retail sales data is sustained, it will further benefit retail stocks.
Dollar
If retail sales data meets or exceeds expectations, it will be positive for the US dollar; conversely, if retail data falls short of expectations, it will weigh on the US dollar.
Special attention should be paid to the control group retail sales growth rate. Last month, US retail sales increased by only 0.2% compared to the previous month, significantly below expectations. However, the key indicator, control group retail sales (excluding automobiles, gasoline, building materials, and food services) accelerated to a 0.6% monthly growth rate in June, indicating strong consumer demand.
After the data was released, the US dollar index (DXY) initially declined over 20 points, but later rebounded by nearly 40 points, eventually closing slightly higher.

【Source:Wall Street Journal】
Therefore, apart from the monthly retail sales rate, attention should also be paid to other sub-item data.
Technical analysis
From a technical perspective, the US Dollar Index has reached the vicinity of its 200-day moving average, encountering strong resistance on the upside. If it manages to break through the key level of 103.5, further upward movement is possible. Conversely, it may experience a retracement if it oscillates downward.
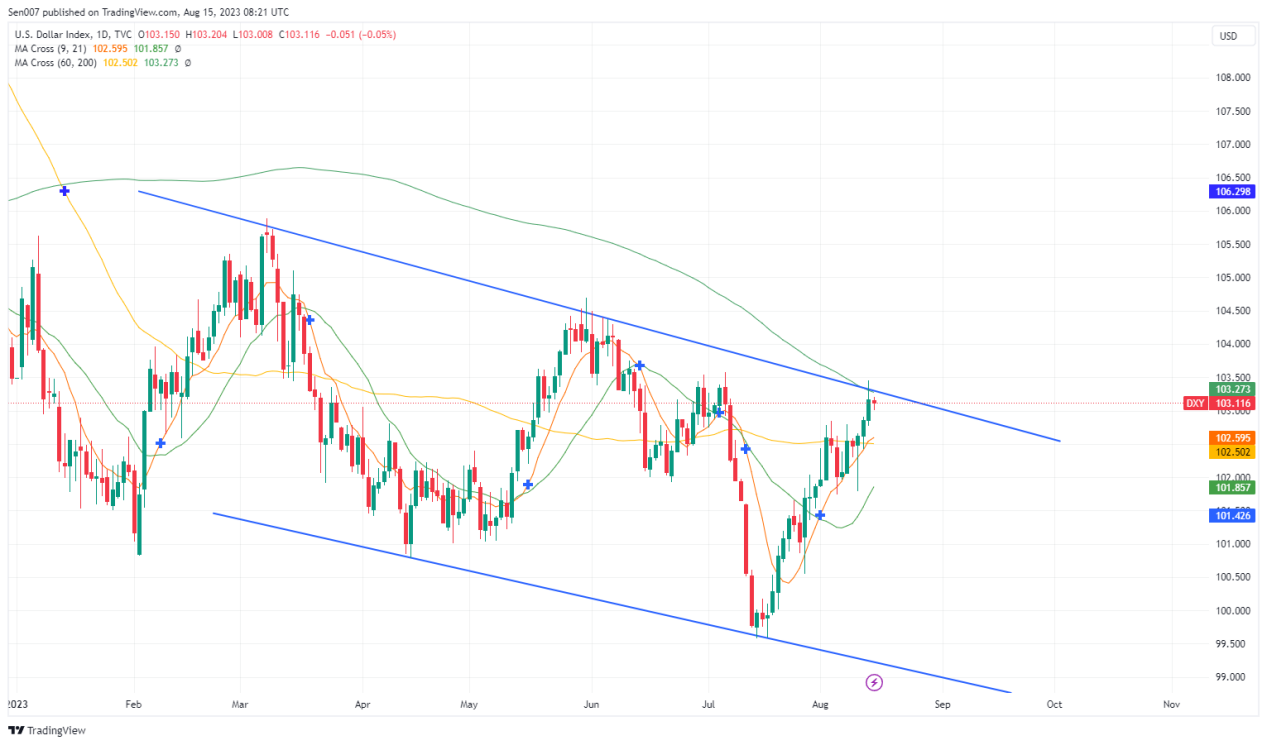
【Source:TradingView】
* The content presented above, whether from a third party or not, is considered as general advice only. This article should not be construed as containing investment advice, investment recommendations, an offer of or solicitation for any transactions in financial instruments.


