GBP/USD Price Analysis: Tumbles below 1.2500 as bears cut bulls hopes short
- Gold slides below $5,000 amid USD uptick and positive risk tone; downside seems limited
- Gold declines to near $4,850 as low liquidity, easing tensions weigh on demand
- Gold weakens as USD uptick and risk-on mood dominate ahead of FOMC Minutes
- Gold rises above $4,950 as US-Iran tensions boost safe-haven demand
- Gold drifts higher to $5,000 on heightened US-Iran tensions
- Top 3 Price Prediction: Bitcoin, Ethereum, Ripple – BTC, ETH and XRP face downside risk as bears regain control

■GBP/USD registers a decline of 0.27%, influenced by US inflation data that suggests the Federal Reserve may delay rate cuts.
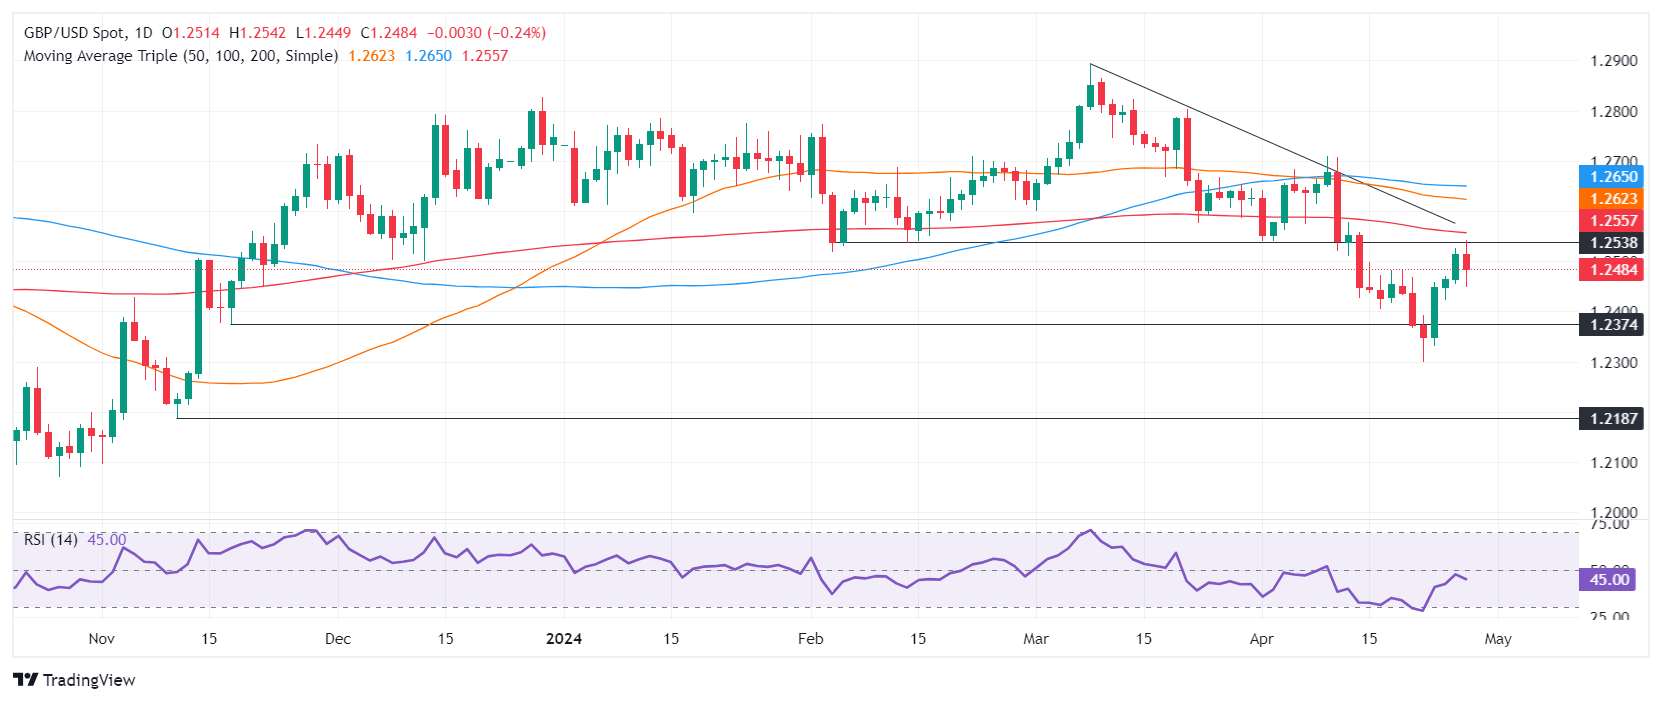
■The pair's recent inability to break the 200-day moving average at 1.2557 highlights its downward bias, with support levels now in focus.
■Potential for further losses if the 'dark cloud cover' candlestick pattern forms, targeting 1.2400 and possibly extending to the YTD low of 1.2300.
During the mid-North American session, the Pound Sterling retreats and registers losses against the US Dollar, slumping below 1.2500. Data from the United States showed that inflation is picking up, which would deter Fed intentions from cutting interest rates. The GBP/USD trades at 1.2481, down 027%.
GBP/USD Price Analysis: Technical outlook
Although the GBP/USD closed three days of consecutive gains, it remains downward biased, as buyers failed to crack stir resistance at the 200-day moving average (DMA) at 1.2557. That exposed the 1.2500 figure, which was surrendered by fundamental news.
If the GBP/USD finishes Friday’s session at around the 1.2480, that will form a ‘dark cloud cover,’ opening the door for further losses. The next support would be 1.2400, followed by the year-to-date (YTD) at 1.2300.
On the other hand, if buyers lift the spot price above 1.2500, that would open the door to challenge the 200-DMA.
GBP/USD Price Action – Daily Chart

Read more
* The content presented above, whether from a third party or not, is considered as general advice only. This article should not be construed as containing investment advice, investment recommendations, an offer of or solicitation for any transactions in financial instruments.


