

USD/CHF Price Forecast: Outlook remains bearish below 0.8250

- Gold Price Forecast: Gold Poised to Break $4,200 as Oil Price Slump Eases Inflation Fears
- Gold declines despite easing concerns over inflation, interest rate hikes
- Fed Decision Eve: 104 Economists Expect No Change; Why Is Citadel Securities Betting on a Surprise Hike?
- Gold Price Forecast: Can Gold Hold $4,020 as Fed Rate Hike Expectations Rise?
- Middle East War updates: US-Iran pause strikes as Trump weighs up diplomatic options
- WTI Oil flirts with the $80 level amid speculation about US-Iran peace talks

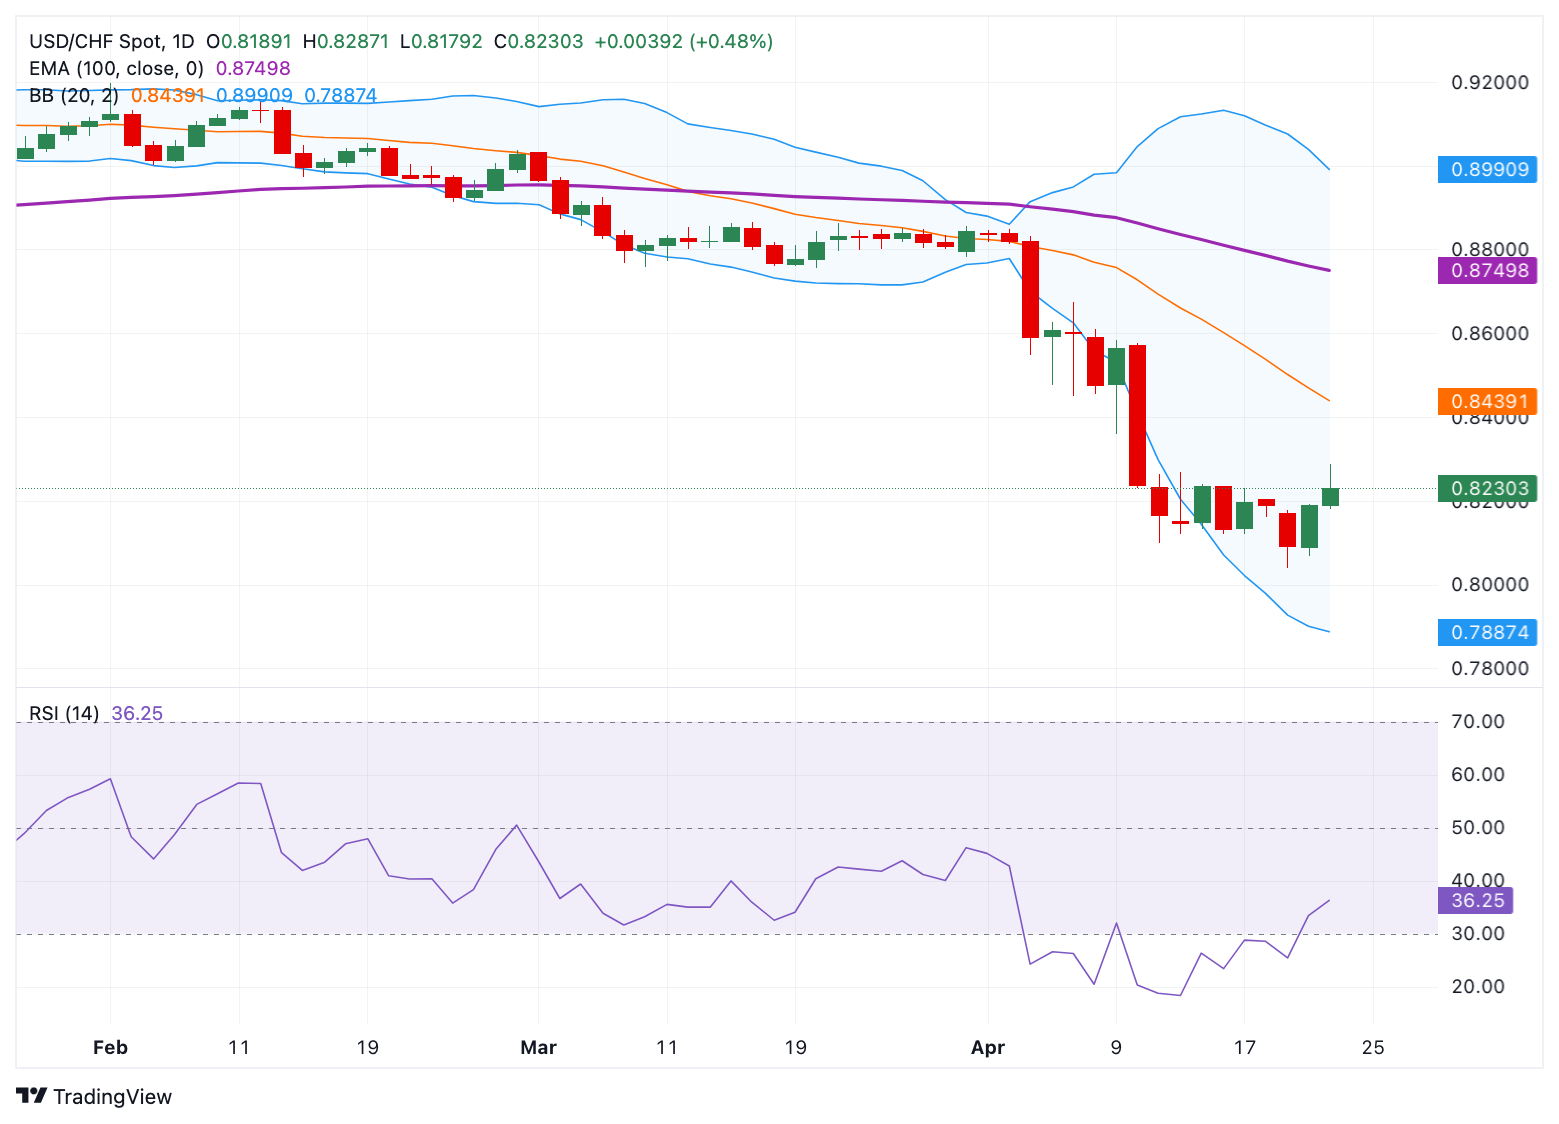
USD/CHF gains traction to around 0.8225 in Wednesday’s early European session.
The negative outlook of the index remains in play below the 100-day EMA with a bearish RSI indicator.
The first support level to watch is 0.8121; the immediate resistance level is seen at 0.8360.
The USD/CHF pair drifts higher to near 0.8225 during the early European session on Wednesday, bolstered by the renewed US Dollar (USD) demand. Hope for the US-China trade deal provides a boost for investors. Additionally, US President Donald Trump backed away from threats of firing Federal Reserve (Fed) Chair Jerome Powell, which provides some support to the Greenback.
According to the daily chart, the bearish sentiment of USD/CHF prevails as the pair is below the key 100-day Exponential Moving Average (EMA). Furthermore, the downward momentum is supported by the 14-day Relative Strength Index (RSI), which stands below the midline near 36.0, supporting the sellers in the near term.
The initial support level for the pair emerges at 0.8121, the low of April 16. Further south, the additional downside filter to watch is 0.8040, the low of April 21. The key contention level is seen at the 0.8000 psychological level.
On the flip side, the first upside barrier for USD/CHF is located at 0.8360, the low of April 9. Any follow-through buying above this level could pave the way to 0.8609 the high of April 8. A decisive break above the mentioned level could see a rally to 0.8750, the 100-day EMA.
USD/CHF daily chart
Read more
* The content presented above, whether from a third party or not, is considered as general advice only. This article should not be construed as containing investment advice, investment recommendations, an offer of or solicitation for any transactions in financial instruments.


