

US Dollar Index Price Forecast: Remains near 107.00, lower descending channel boundary

- Gold Price Trend Forecast: Expectations of Easing US-Iran Tensions Boost Gold Prices, $4,070 Becomes Key Level for Bulls and Bears
- Gold rallies to over two-week high, eyes $4,150 as traders track US-Iran diplomacy efforts
- Euro declines to near 1.1400 as US launches fresh strikes on Iran
- Tesla Q2 Earnings Preview: Record Deliveries Fail to Hide Profit Pressure, Can Musk Rely on AI and Autonomous Driving to Unlock New Growth Space?
- WTI surges above $83.00 amid escalating US-Iran conflict
- WTI climbs above $87.00 as Middle East conflict threatens key choke points

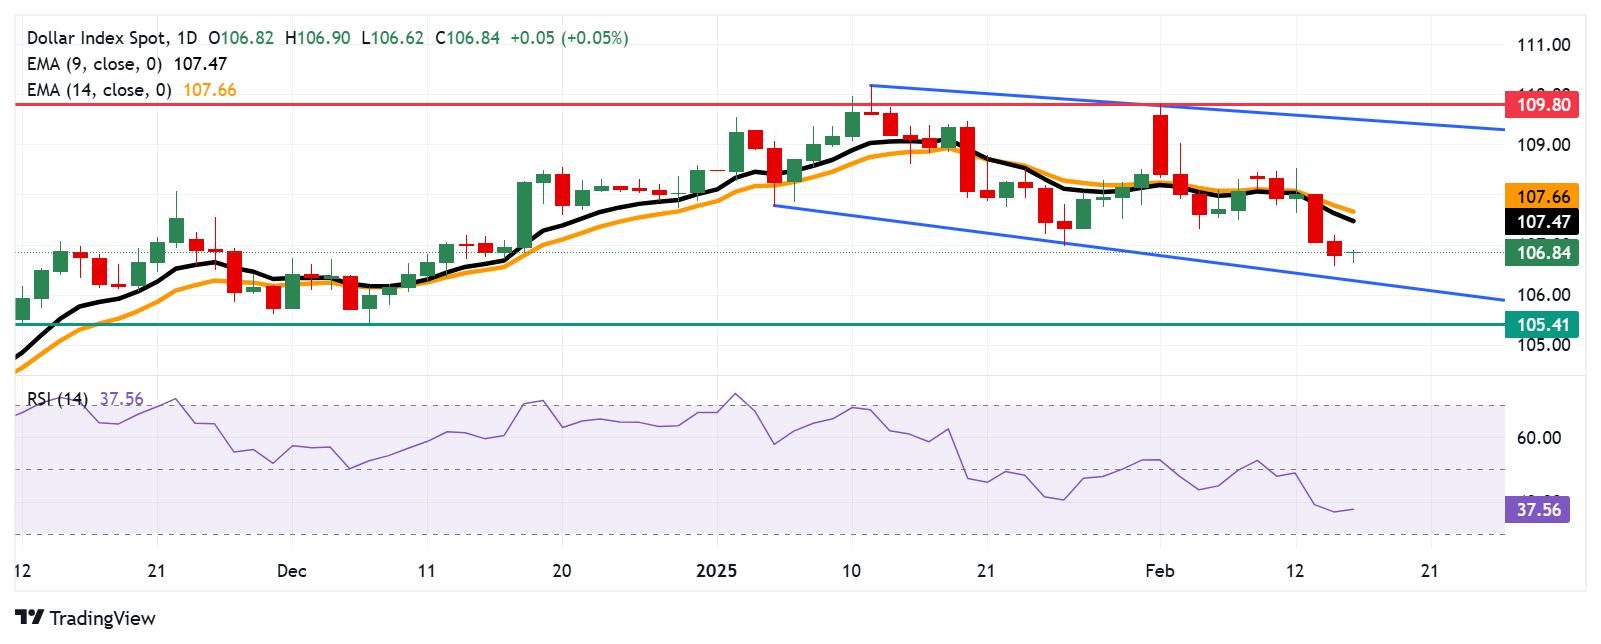
The US Dollar Index may find key support near the descending channel’s lower boundary at 106.30.
The 14-day RSI is below 50, signaling increasing bearish momentum.
The primary resistance appears at the nine-day EMA at 107.47
The US Dollar Index (DXY) edges higher after registering losses in the previous two consecutive sessions, trading around 106.90 during the European hours on Monday. A review of the daily chart suggests a prevailing bearish bias as the index consolidates within the descending channel pattern.
However, the 14-day Relative Strength Index (RSI) is positioned below the 50 level, indicating a strengthening bearish momentum. Furthermore, the US Dollar Index remains positioned below the nine- and 14-day Exponential Moving Averages (EMAs), confirming the short-term price momentum is weaker.
On the downside, the DXY could approach the lower boundary of the descending channel at 106.30 level, followed by the psychological level of 106.00. A break below this level could reinforce the bearish bias and put downward pressure on the index to test the three-month low at 105.41, which was recorded on December 6.
Regarding resistance, the DXY could find its primary resistance at nine-day EMA at 107.47, followed by 107.66. A decisive break above these levels would improve the short-term price momentum and support the pair to explore the region around the descending channel’s upper boundary at 109.50 level, followed by the five-week high of 109.80, last tested on February 3.
US Dollar Index: Daily Chart
Read more
* The content presented above, whether from a third party or not, is considered as general advice only. This article should not be construed as containing investment advice, investment recommendations, an offer of or solicitation for any transactions in financial instruments.


