

GBP/USD climbed its way above 1.3660 for the first time in over 40 months on Wednesday.
The Pound Sterling is getting a boost from broad-market Greenback selling.
A smattering of central bank policymaker appearance dot the landscape ahead of GDP updates.
GBP/USD gained more ground as the US Dollar waffles across the board, extending into a third straight day of firm gains and clipping its highest bids in four and a half years. Several central bank policymakers from both the Bank of England (BoE) and the Federal Reserve (Fed) made appearances through the first half of the week, and the trend is expected to continue through the remainder of it.
Fed Chair Jerome Powell wrapped up his two-day stretch of testimony before congressional and Senate financial committees on Wednesday, sticking close to the familiar Fed script and reiterating multiple times the Fed’s wait-and-see stance. The Fed has laid the broad unease about economic conditions at the Trump administration’s feet, and is avoiding making any adjustments to interest rates until the full effects of Donald Trump’s whiplash tariff strategy can be observed.
BoE Governor Andrew Bailey will be taking a turn to address the public on Thursday, where he will be delivering talking points at the British Chambers of Commerce’s annual conference, aptly titled “Where’s the growth?”. UK Gross Domestic Product (GDP) growth figures will follow on Friday, and are expected to show 0.7% QoQ growth through the first quarter.
Before UK growth figures, US Q1 GDP data will be dropping on Thursday. Annualized US GDP is expected to hold steady at -0.2% QoQ as the US economy begins to grapple with its own potential economic slowdown just over the horizon.
GBP/USD price forecast
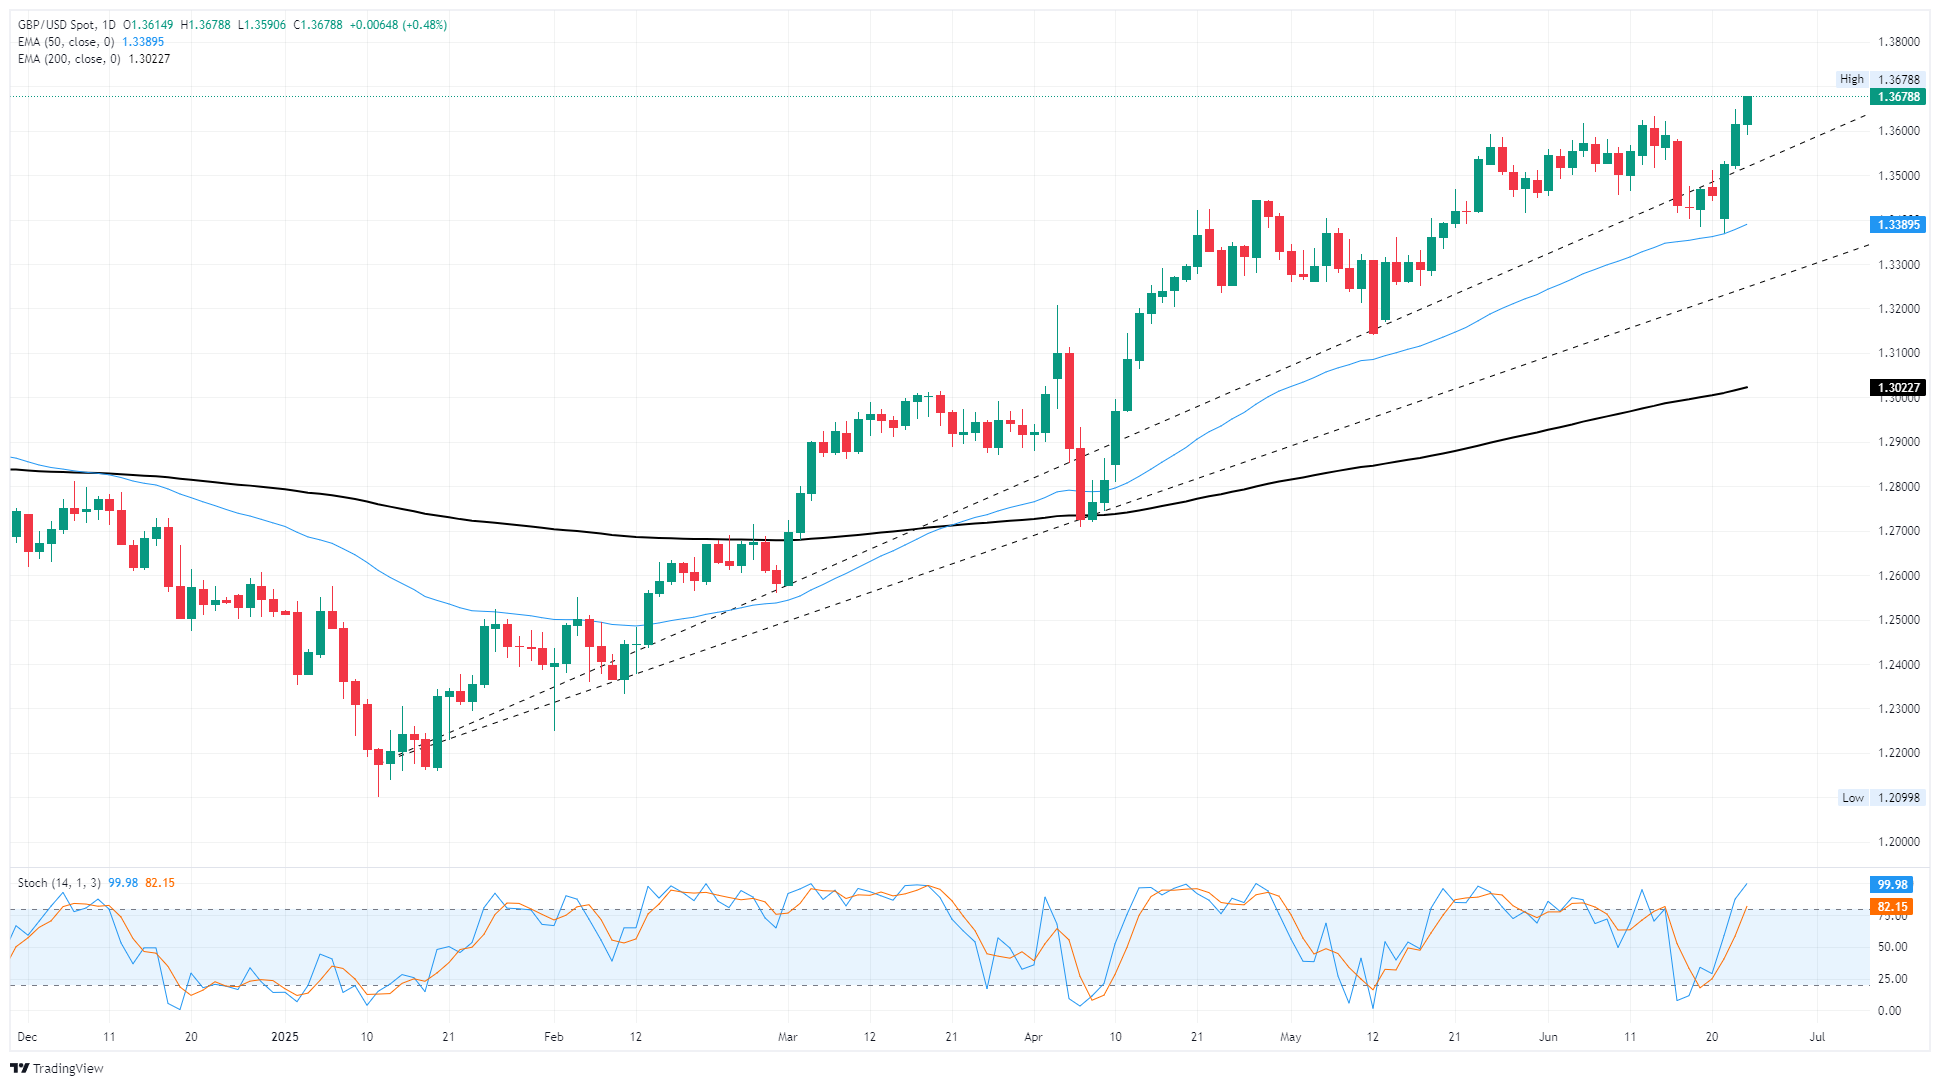
GBP/USD caught an extended ride into fresh 41-month highs on Wednesday, climbing above 1.3660 for the first time since January of 2022. The pair is on pace to close in the green for a fifth straight month as the US Dollar broadly weakens across the board.
Cable bidders may be flying too close to the sun as GBP/USD price quickly outrun rising trendlines, with price action trading well above the 200-day Exponential Moving Average (EMA) near 1.3020. Technical oscillators are pinned in overbought territory, warning of a potential pullback on the cards.
GBP/USD daily chart
* The content presented above, whether from a third party or not, is considered as general advice only. This article should not be construed as containing investment advice, investment recommendations, an offer of or solicitation for any transactions in financial instruments.


