

Top 3 Price Prediction: BTC, ETH, and XRP recover as the key support level holds

- Bitcoin Drops to $70,000. U.S. Government Refuses to Bail Out Market, End of Bull Market or Golden Pit?
- Gold rallies further beyond $5,050 amid flight to safety, dovish Fed expectations
- Bitcoin Bottom Debate: $70,000 or $50,000?
- A Crash After a Surge: Why Silver Lost 40% in a Week?
- Bitcoin Slips Below 75,000 Mark. Will Strategy Change Its Mind and Sell?
- Bitcoin Rout. Bridgewater Founder Dalio Publicly Backs Gold.

Bitcoin price hovers around $111,900 on Monday, after falling 2.66% the previous week.
Ethereum recovers trading around $4,120 after finding support around the 100-day EMA.
XRP holds support at $2.72, with bulls eyeing a potential recovery from recent declines.
Bitcoin (BTC), Ethereum (ETH) and Ripple are showing signs of stabilization at the start of the week, each holding above key support levels after recent declines. While BTC struggles to regain momentum near $112,000, ETH and XRP are finding their footing, which could pave the way for short-term recoveries.
Bitcoin shows some signs of recovery
Bitcoin price failed to find support around $116,000 on September 19 and declined by 6%, reaching a low of $108,631 on Thursday. However, BTC recovered slightly in the next three days. At the time of writing on Monday, it trades at around $111,700.
If BTC continues its recovery and closes above the 50-day Exponential Moving Average (EMA) at 113,232 on a daily basis, it could extend the recovery toward the daily resistance at $116,000.
The Relative Strength Index (RSI) on the daily chart reads 45, pointing upwards and nearing its neutral level of 50, which indicates a fading bearish momentum. For the recovery rally to be sustained, the RSI must move above the neutral level.
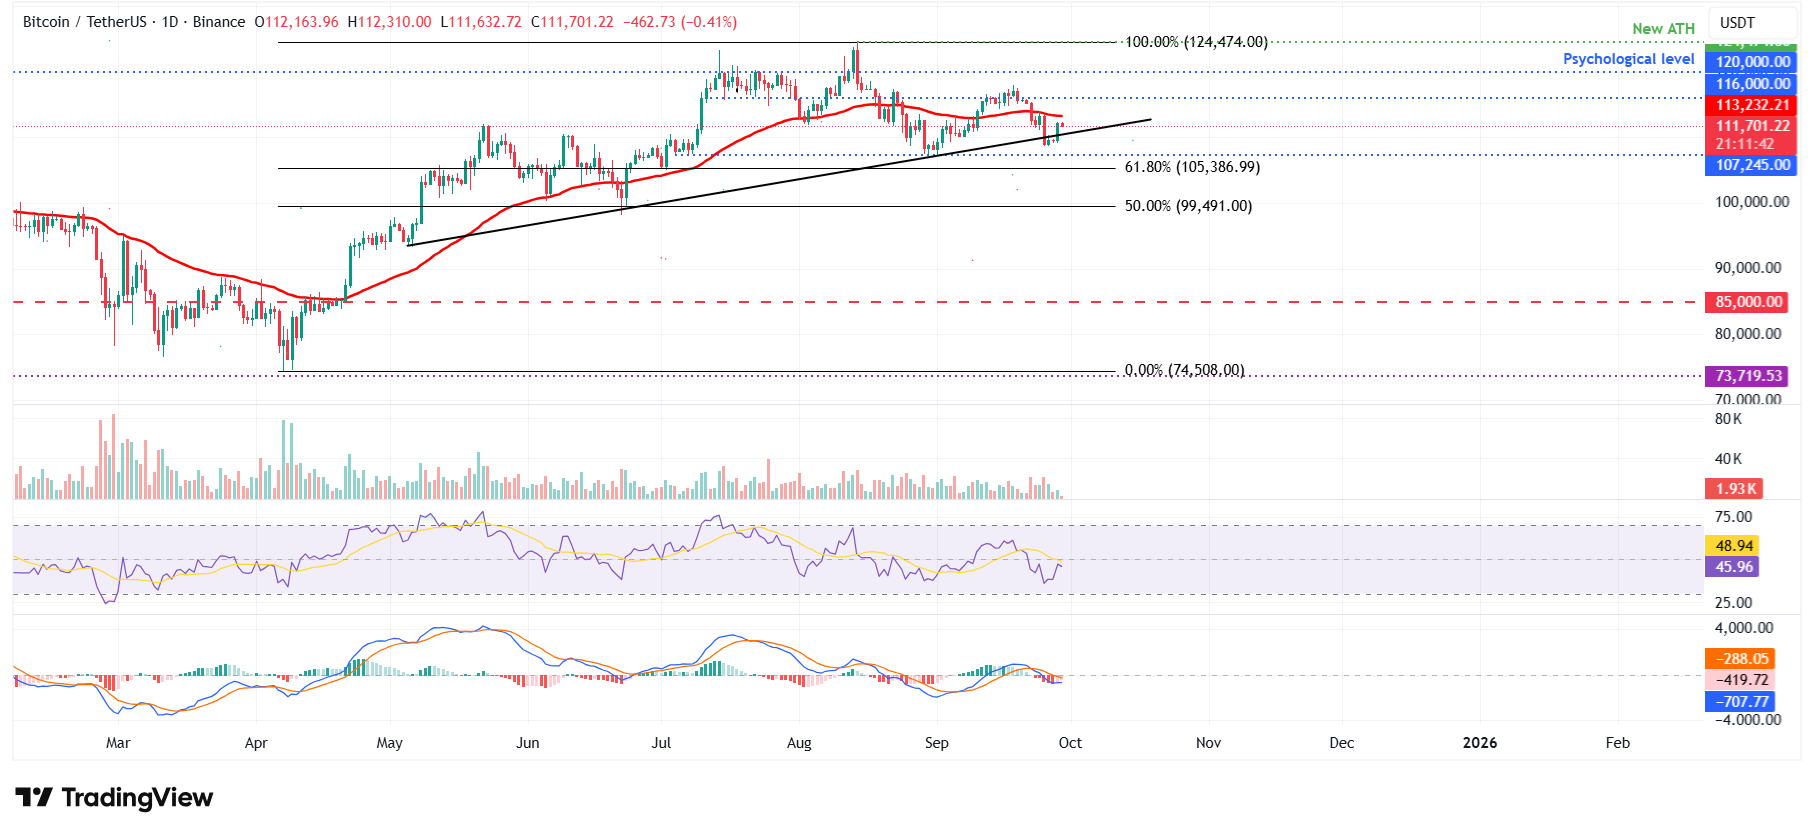
BTC/USDT daily chart
However, if BTC fails to close above the 50-day EMA and faces a correction, it could extend the decline toward the daily support at $107,245.
Ethereum could extend its recovery if it closes above $4,232 mark
Ethereum price failed to find support around the daily level at $4,232 last week and declined 7.36% until Thursday. However, on Friday, ETH retested and found support around the 100-day EMA at $3,863, and by Sunday, it had recovered 7.10%. At the time of writing on Monday, it trades at around $4,100.
If ETH continues its recovery and closes above $4,232, it could extend the rally toward the next daily resistance at $4,488.
Like Bitcoin, Ethereum’s RSI reads 42 and, pointing upwards and nearing its neutral level of 50, indicates fading bearish momentum. For the recovery rally to be sustained, the RSI must move above the neutral level.
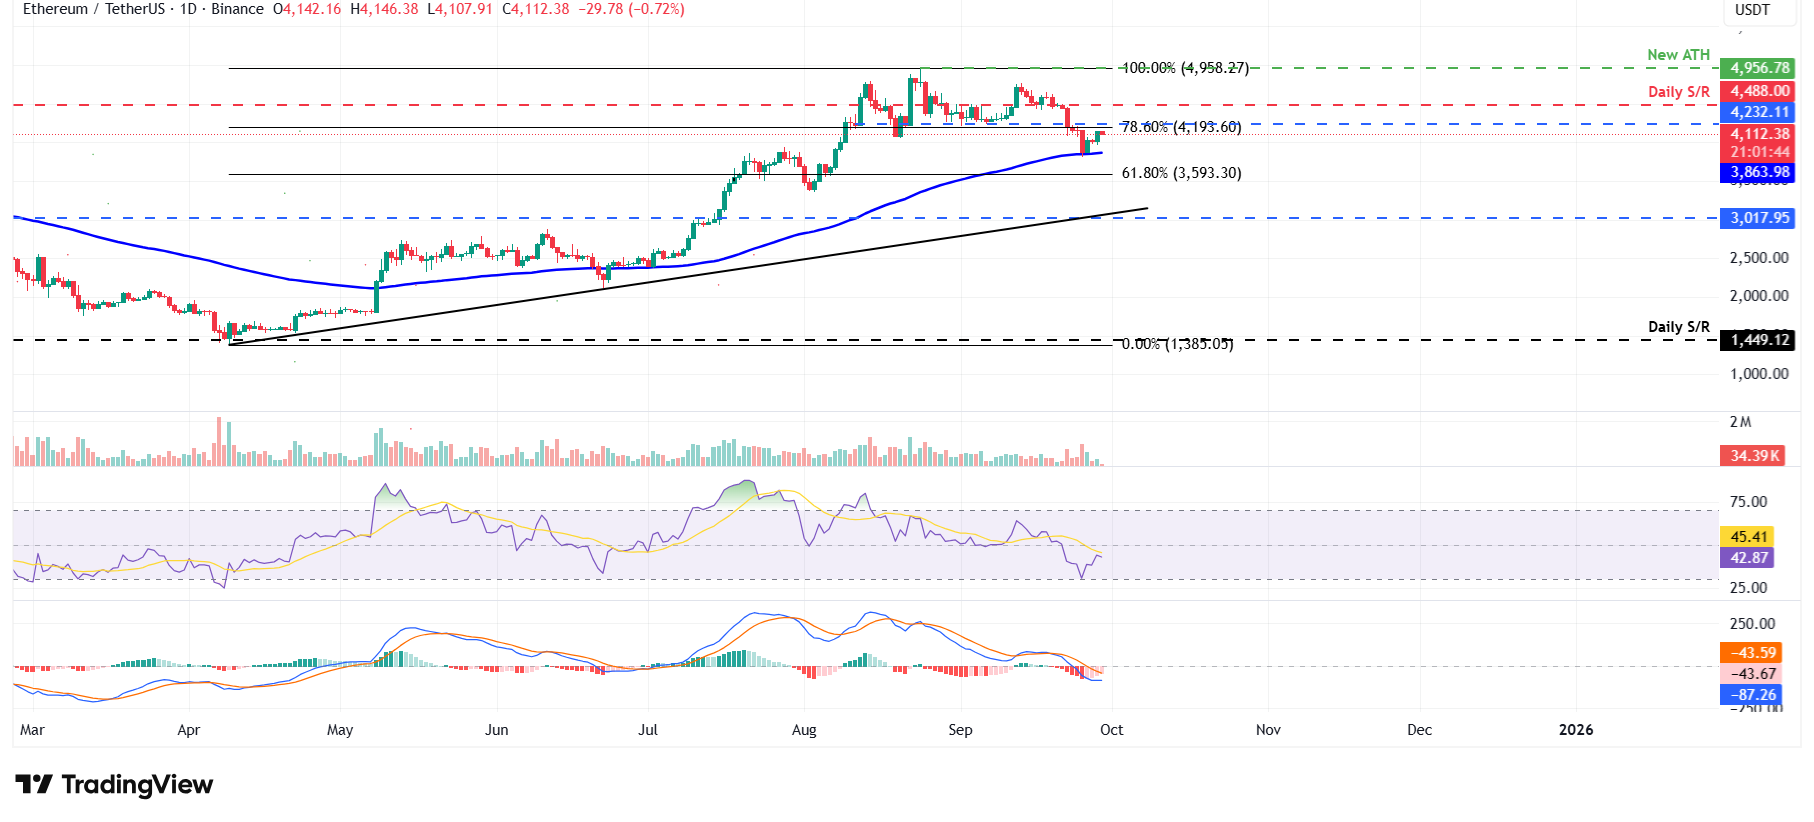
ETH/USDT daily chart
On the other hand, if ETH faces a correction, it could extend the decline toward the 100-day EMA at $3,863.
XRP shows signs of fading bearish momentum
Ripple’s XRP price corrected after retesting its daily level at $2.93 on Thursday and declined 6.23%. XRP retested the daily support at $2.72 the next day and recovered 4.52% by Sunday. At the time of writing on Monday, it trades at around $2.86.
If XRP closes above the $2.93 resistance level, it could extend the rally toward the key psychological level at $3.
Like BTC and ETH, XRP RSI also shows fading bearish momentum. However, for the recovery rally to be sustained, the RSI must move above the neutral level.
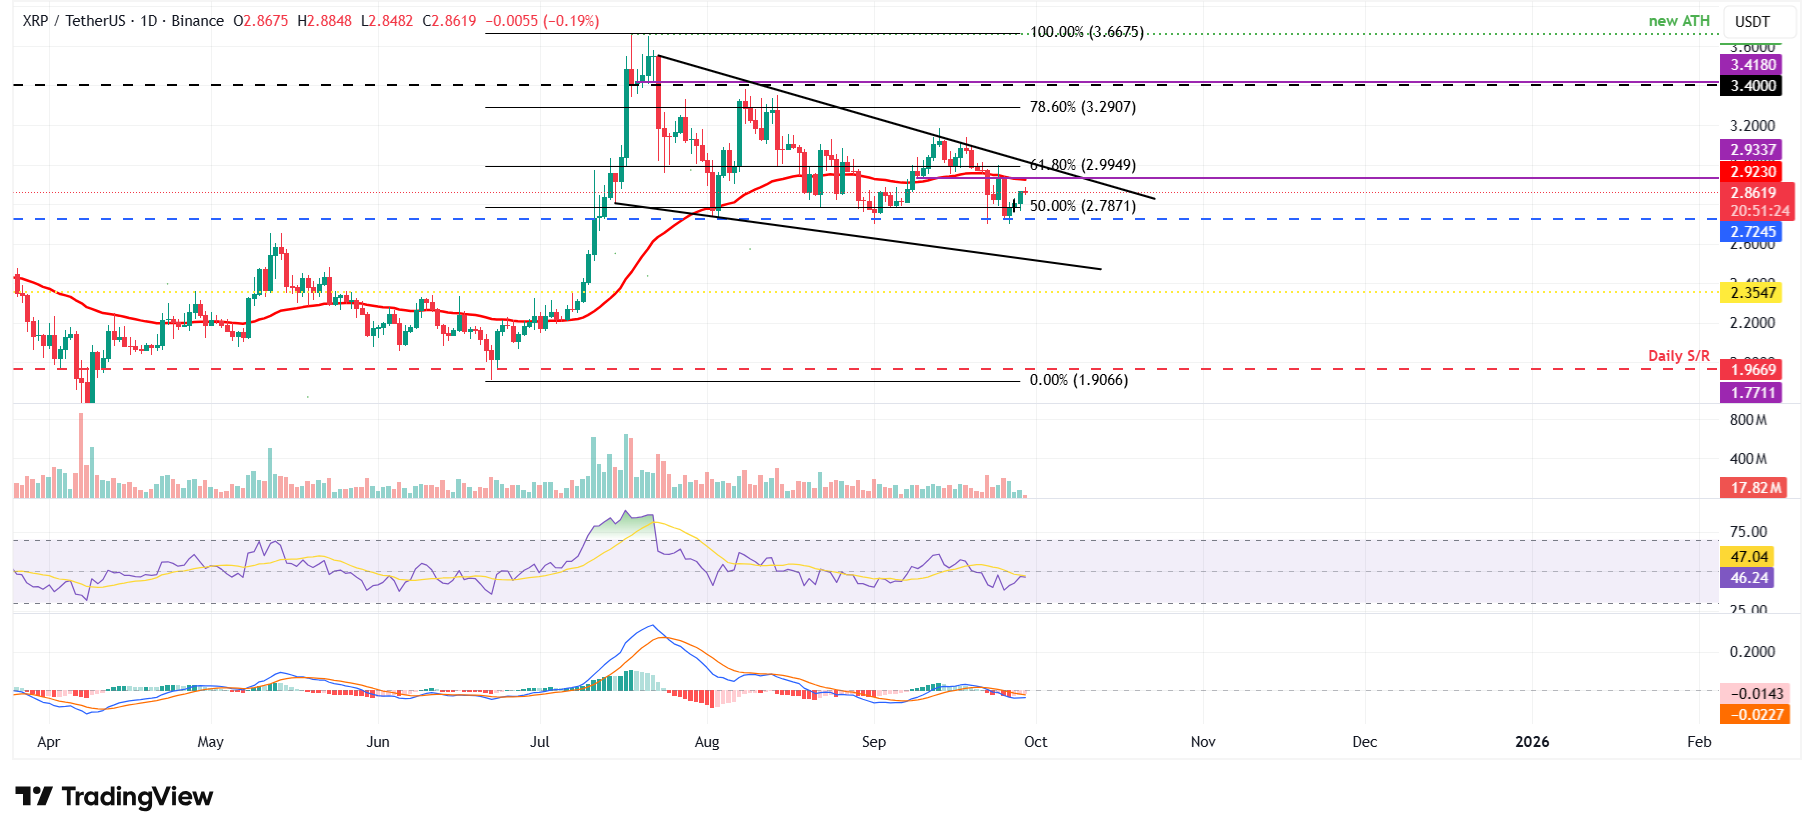
XRP/USDT daily chart
However, if XRP faces a correction, it could extend the decline toward the daily support at $2.72.
Read more
* The content presented above, whether from a third party or not, is considered as general advice only. This article should not be construed as containing investment advice, investment recommendations, an offer of or solicitation for any transactions in financial instruments.


