

EUR/USD dips further against a firmer US Dollar on renewed debt fears

- WTI Oil pulls back as Hormuz supply worries ease, Iran-US tensions keep volatility high
- Trump says US to help ships stranded in Strait of Hormuz as tanker hit by projectiles
- Bitcoin Price Forecast: BTC hits three-month high on derivatives-led surge
- Australian Dollar holds losses ahead of RBA policy decision
- Gold holds steady near $4,600 as Fed rate decision looms
- Crypto Overview: Toncoin, Terra Classic rise by double digits as Bitcoin grips $80,000

The Euro posts minor losses on Tuesday as debt fears return to the market.
French long-term yields escalated to their highest levels since 2009 amid the uncertain political outlook.
Later in the day, Eurozone Services PMI data might provide some support to the Euro.
The EUR/USD pair is heading south for the second consecutive day on Wednesday, trading at 1.1620 at the time of writing. Renewed concerns about the increasing fiscal deficits in major economies have triggered a sell-off in bond markets, steepening yield curves, and driving investors towards safe assets like the US Dollar and Gold.
The German 30-year yield has risen 10 basis points over the last three days, while French long-term yields rose to 4.50%, their highest level since 2009, after having rallied sharply in August amid the country's uncertain political outlook.
The US Dollar thrived in risk-averse markets, unfazed by the disappointing US ISM Manufacturing Purchasing Managers Index (PMI) data, which revealed that the sector's activity contracted for the sixth consecutive month in August.
Market sentiment remains sour on Wednesday, although risk aversion seems to have eased somewhat. In Europe, August's HCOB Services PMI due later will be the main data point, while in the US, Factory Orders and JOLTS Job Openings will provide the fundamental guidance for the US Dollar.
Euro Price Today
The table below shows the percentage change of Euro (EUR) against listed major currencies today. Euro was the strongest against the Japanese Yen.

The heat map shows percentage changes of major currencies against each other. The base currency is picked from the left column, while the quote currency is picked from the top row. For example, if you pick the Euro from the left column and move along the horizontal line to the US Dollar, the percentage change displayed in the box will represent EUR (base)/USD (quote).
Daily digest market movers: Eurozone debt fears have offset investors' expectations of Fed rate cuts
Concerns about fiscal recklessness in major economies have returned to the market, triggering a sell-off in government bonds worldwide. Fed intrerest rate cuts hopes have taken the back seat, and the US Dollar (USD) has rallied against its main peers on the back of its safe-haven status.
US ISM Manufacturing PMI improved to 48.7 in August from 48.0 in July, undershooting the market expectations of a 49.0 reading.
Somewhat earlier, the S&P Global Manufacturing PMI showed a brighter picture, with a 53 reading, after 53.3 in July, yet with the report highlighting higher prices and supply concerns stemming from US President Donald Trump's trade tariffs.
In Wednesday's economic calendar, the focus will be on services activity. Eurozone's HCOB Services PMI is expected to confirm the 50.7 preliminary estimation for August, a moderate slowdown from the four-month high of 51 seen over the previous month.
In the US, July's Factory Orders are expected to have contracted at a 1.4% pace, following a 4.8% fall in June, providing further evidence that tariffs are already weighing on industrial activity.
At the same time, the US JOLTS Job Openings will be the first of a string of labour market indicators this week and are expected to have remained fairly steady, at 7.4 million in August after July's 7.437 million openings.
Technical Analysis: EUR/USD declines within range, with key support at the 1.1585 area
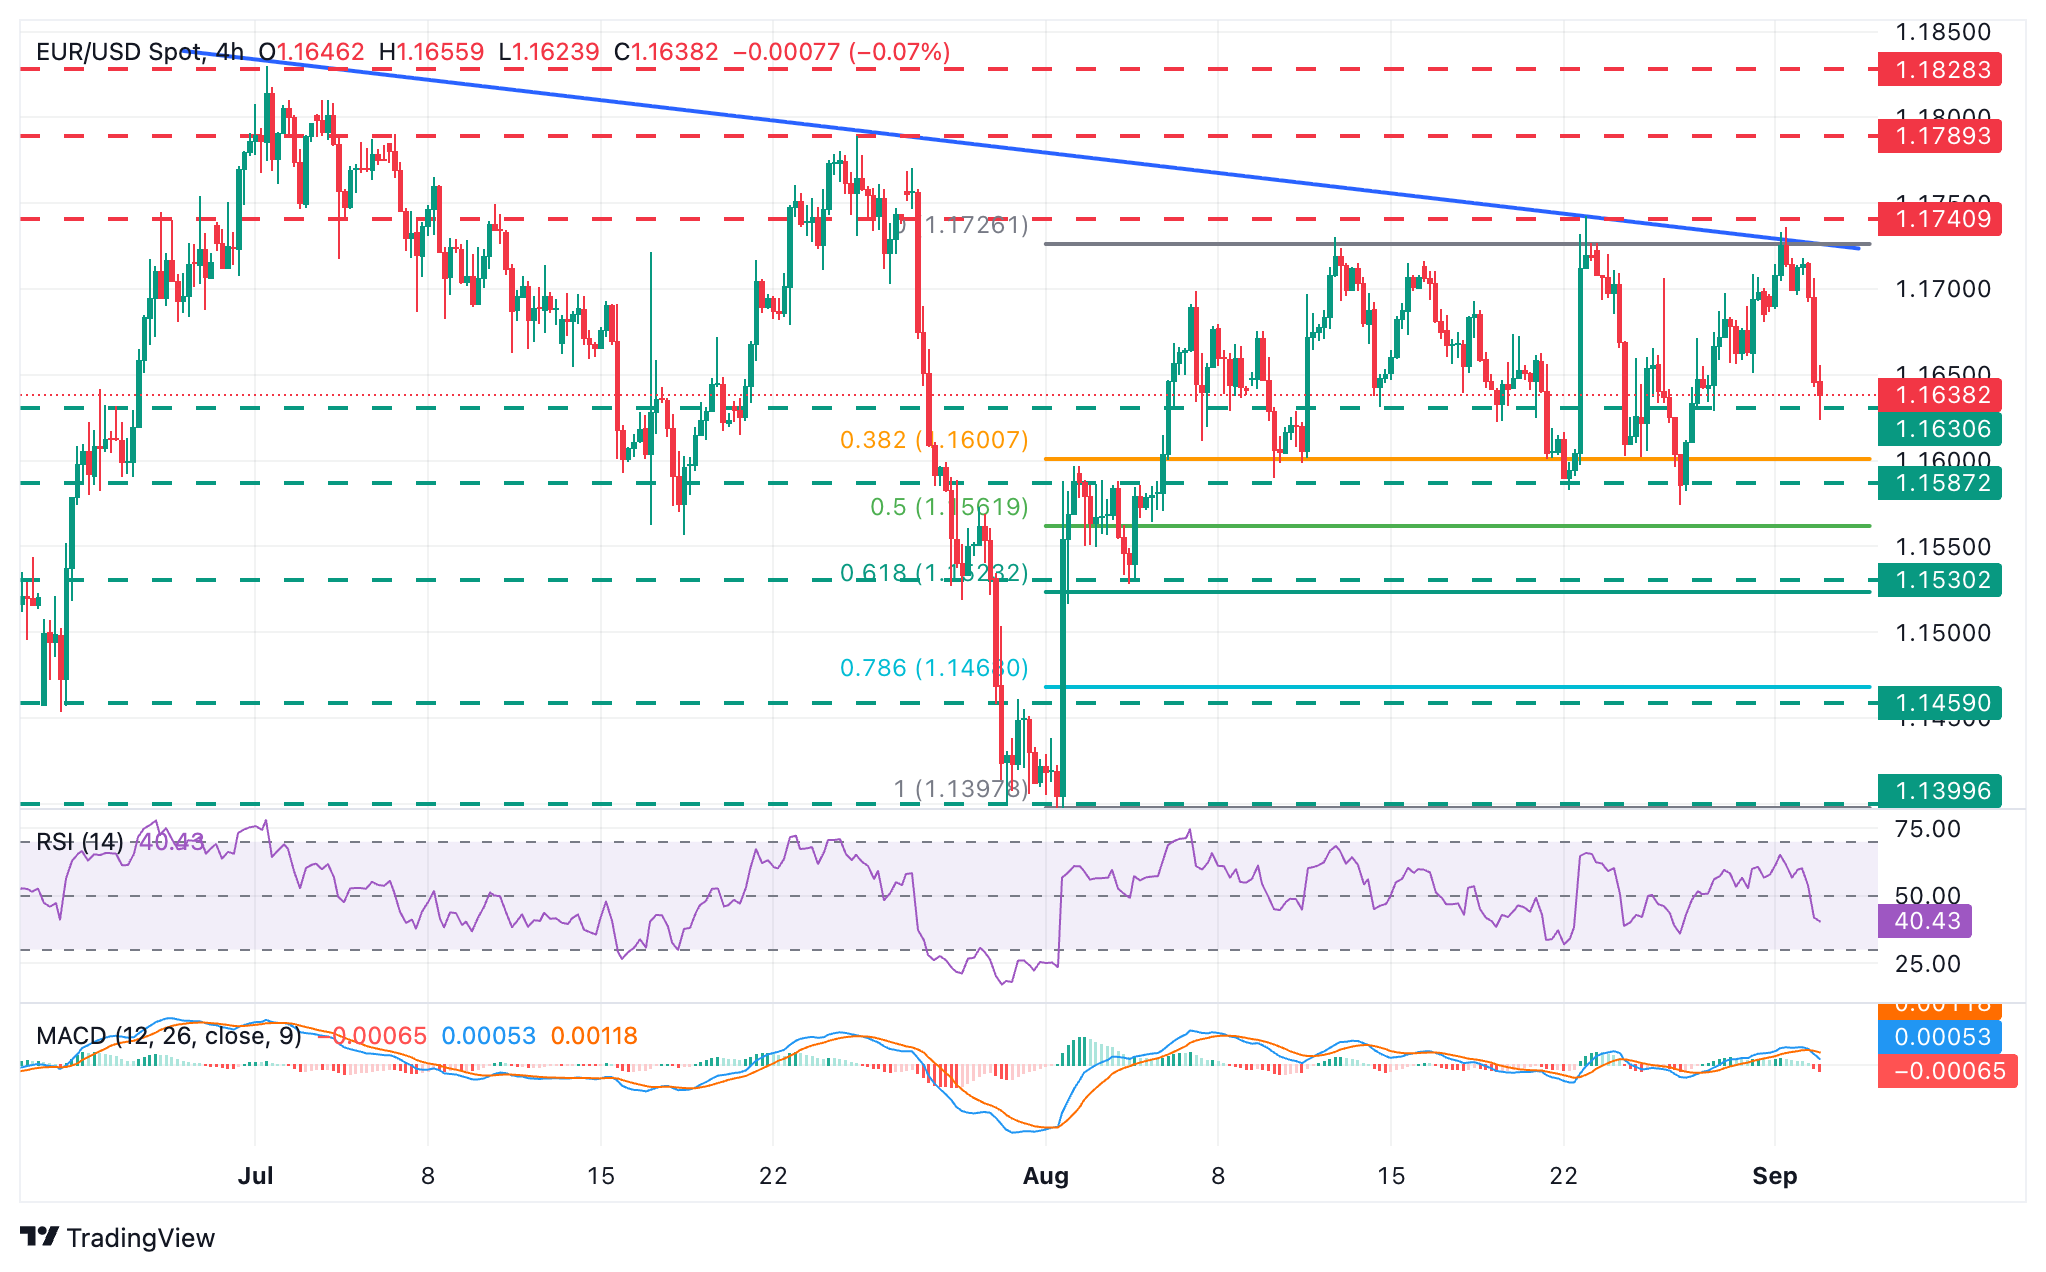
EUR/USD came under pressure after its rejection at 1.1740 on Monday. Looking from a wider perspective, however, the pair remains looking for direction within the broadly 150-pip range that has contained price action for most of August.
The pair seems to have found some footing at Tuesday's lows around the 1.1615 area, ahead of the bottom of the monthly range between 1.1575 and 1.1590, which capped bears on August 11, 22 and 27. Further down, the 50% Fibonacci retracement level of the early August bullish run, at 1.1560, might provide some support ahead of the August 5 low, near 1.1530.
To the upside, the intraday level of 1.1680 might offer some resistance ahead of the confluence between the descending trendline resistance, now around 1.1730 and 1.1740, which encompasses the peaks of August 13 and 22, and the September 1 high, is likely to pose a serious challenge for bulls.
Read more
* The content presented above, whether from a third party or not, is considered as general advice only. This article should not be construed as containing investment advice, investment recommendations, an offer of or solicitation for any transactions in financial instruments.


