EUR/JPY Price Analysis: Bullish run faces overbought risks, hovers around 169.00

Mitrade
Trending Articles
coverImg
Source: DepositPhotos
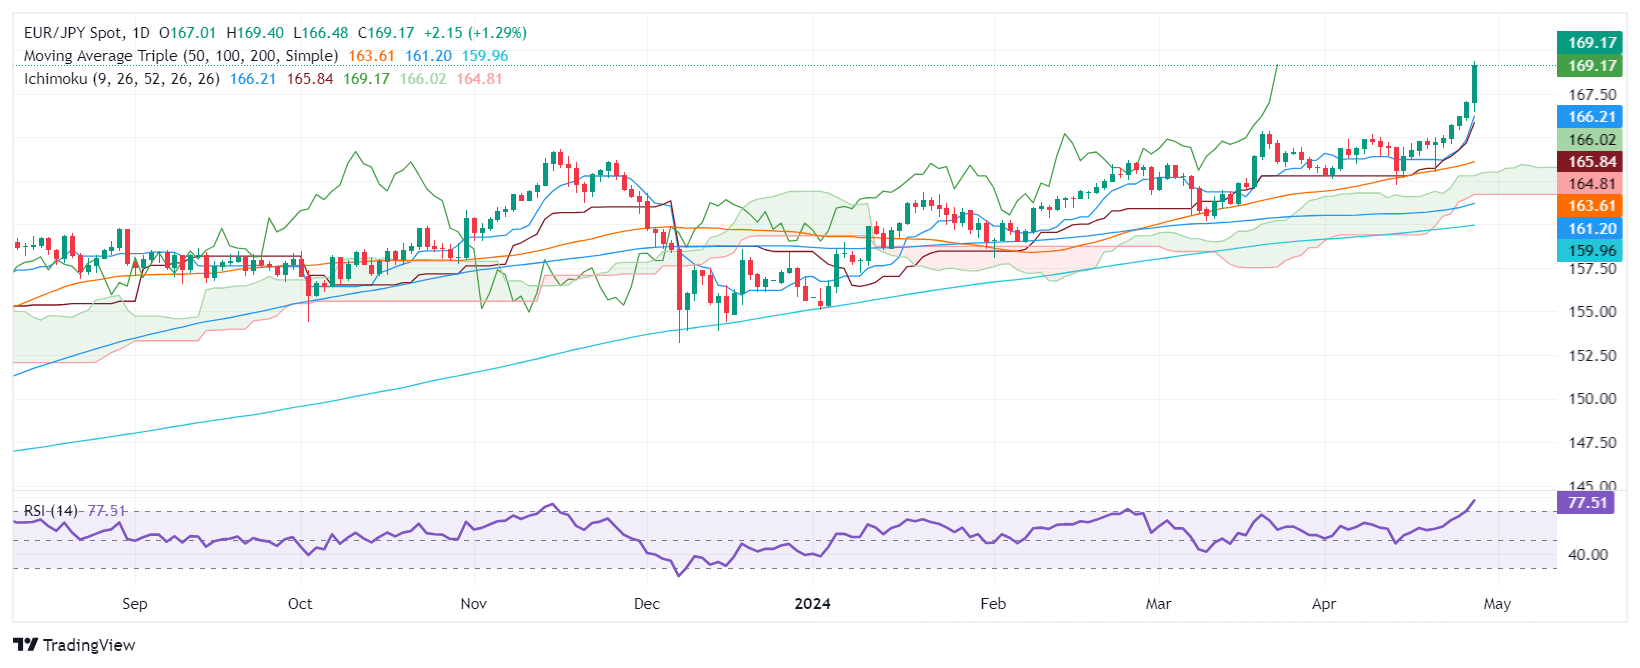
  • EUR/JPY climbs nearing the pivotal 169.00 mark, propelled by strong risk appetite and market gains.


  • Technical analysis shows a robust uptrend, though an RSI of 76.00 signals overbought conditions.


  • If the pair surpasses 169.00, it faces resistance at the July 2008 high of 169.97, closely followed by the key 170.00 level.


  • A drop below 169.00 could lead to a pullback to 168.00, further potential supports at the Tenkan-Sen at 166.20 and the Kijun-Sen at 165.84.


The EUR/JPY rallies toward the 169.00 figure yet remains shy of breaching it as risk appetite improves, as Wall Street depicts. At the time of writing, the cross-pair trades at 168.89 and is up by 1.12%.


EUR/JPY Price Analysis: Technical outlook


The daily chart depicts the EUR/JPY as upward biased, even though the rally has overextended. The Relative Strength Index (RSI) is at 76.00, usually seen as overbought, but due to the strength of the uptrend, the 80.00 level is seen as the most extreme condition.


If buyers reclaim the 169.00, the next supply zone would be the July 2008 high of 169.97. Once those two levels are cleared, the next supply zone would be 170.00.


On the flip side, a daily close below 169.00, would pave the way for a retracement to 168.00. Subsequent losses are seen below the Tenkan-Sen at 166.20, followed by the Kijun-Sen at165.84


EUR/JPY Price Action – Daily Chart, Soucre: TradingView.


EUR/JPY

Overview
Today last price 168.88
Today Daily Change 1.86
Today Daily Change % 1.11
Today daily open 167.02
 
Trends
Daily SMA20 164.5
Daily SMA50 163.46
Daily SMA100 161.07
Daily SMA200 159.9
 
Levels
Previous Daily High 167.09
Previous Daily Low 165.93
Previous Weekly High 165.03
Previous Weekly Low 162.67
Previous Monthly High 165.36
Previous Monthly Low 160.22
Daily Fibonacci 38.2% 166.65
Daily Fibonacci 61.8% 166.37
Daily Pivot Point S1 166.27
Daily Pivot Point S2 165.52
Daily Pivot Point S3 165.11
Daily Pivot Point R1 167.43
Daily Pivot Point R2 167.84
Daily Pivot Point R3 168.59


Read more

  • Tesla Stock Hits Record High as Robotaxi Tests Ignite Market. Why Is Goldman Sachs Pouring Cold Water on Tesla?
  • Pound Sterling slumps as UK inflation falls by more than expected to 3.2%
  • AUD/USD remains depressed below mid-0.6600s; downside seems limited ahead of US NFP report
  • * The content presented above, whether from a third party or not, is considered as general advice only.  This article should not be construed as containing investment advice, investment recommendations, an offer of or solicitation for any transactions in financial instruments.

    goTop
    quote
    Related Articles
    placeholder
    Australian Dollar deepens losses despite rising Consumer Inflation ExpectationsThe Australian Dollar (AUD) loses ground against the US Dollar (USD) on Thursday for the sixth successive day.
    Author  FXStreet
    11 hours ago
    The Australian Dollar (AUD) loses ground against the US Dollar (USD) on Thursday for the sixth successive day.
    placeholder
    Pound Sterling slumps as UK inflation falls by more than expected to 3.2%The Pound Sterling (GBP) faces intense selling pressure against its major currency peers on Wednesday and slides over 0.5% to near 1.3340 against the US Dollar (USD), following the release of the United Kingdom (UK) Consumer Price Index (CPI) data for November.
    Author  FXStreet
    Yesterday 09: 07
    The Pound Sterling (GBP) faces intense selling pressure against its major currency peers on Wednesday and slides over 0.5% to near 1.3340 against the US Dollar (USD), following the release of the United Kingdom (UK) Consumer Price Index (CPI) data for November.
    placeholder
    FX Today: US soft data maintains US Dollar under pressureThe US Dollar Index (DXY) tumbled below 98.00 on Tuesday, reaching its lowest level since mid-October. The Greenback faced intense selling pressure following a delayed labor report that revealed a significant softening in the US job market, overshadowing weak economic activity data from Europe.
    Author  FXStreet
    Yesterday 01: 31
    The US Dollar Index (DXY) tumbled below 98.00 on Tuesday, reaching its lowest level since mid-October. The Greenback faced intense selling pressure following a delayed labor report that revealed a significant softening in the US job market, overshadowing weak economic activity data from Europe.
    placeholder
    AUD/USD remains depressed below mid-0.6600s; downside seems limited ahead of US NFP reportThe AUD/USD pair attracts some sellers for the fourth straight day on Tuesday and trades around the 0.6630 region, down just over 0.10%, during the Asian session.
    Author  FXStreet
    Dec 16, Tue
    The AUD/USD pair attracts some sellers for the fourth straight day on Tuesday and trades around the 0.6630 region, down just over 0.10%, during the Asian session.
    placeholder
    AUD/USD holds steady below 0.6650, highest since September ahead of China's trade dataThe AUD/USD pair enters a bullish consolidation phase at the start of a new week and oscillates in a narrow range near its highest level since September 16, touched on Friday.
    Author  FXStreet
    Dec 08, Mon
    The AUD/USD pair enters a bullish consolidation phase at the start of a new week and oscillates in a narrow range near its highest level since September 16, touched on Friday.

    Forex Related Articles

    • Trading Chart Patterns:Ultimate Guide to Price Action
    • 06 Leading Forex Trading Apps in Australia: Reviews & Download Links
    • Forex Market Hours, Every Forex Trader Cannot Miss
    • Top 10 Must-Have Forex Technical Indicators That Every Trader Should Use
    • 7 Powerful Forex Trading Strategies/Tips for Consistent Profits
    • EUR/USD Forecast In 2024/2025/2026: Which EUR Pairs Should I Buy?

    Click to view more