EUR/JPY Price Analysis: Bullish momentum prevails, reaches its highest since 2008

Mitrade
Trending Articles
coverImg
Source: DepositPhotos

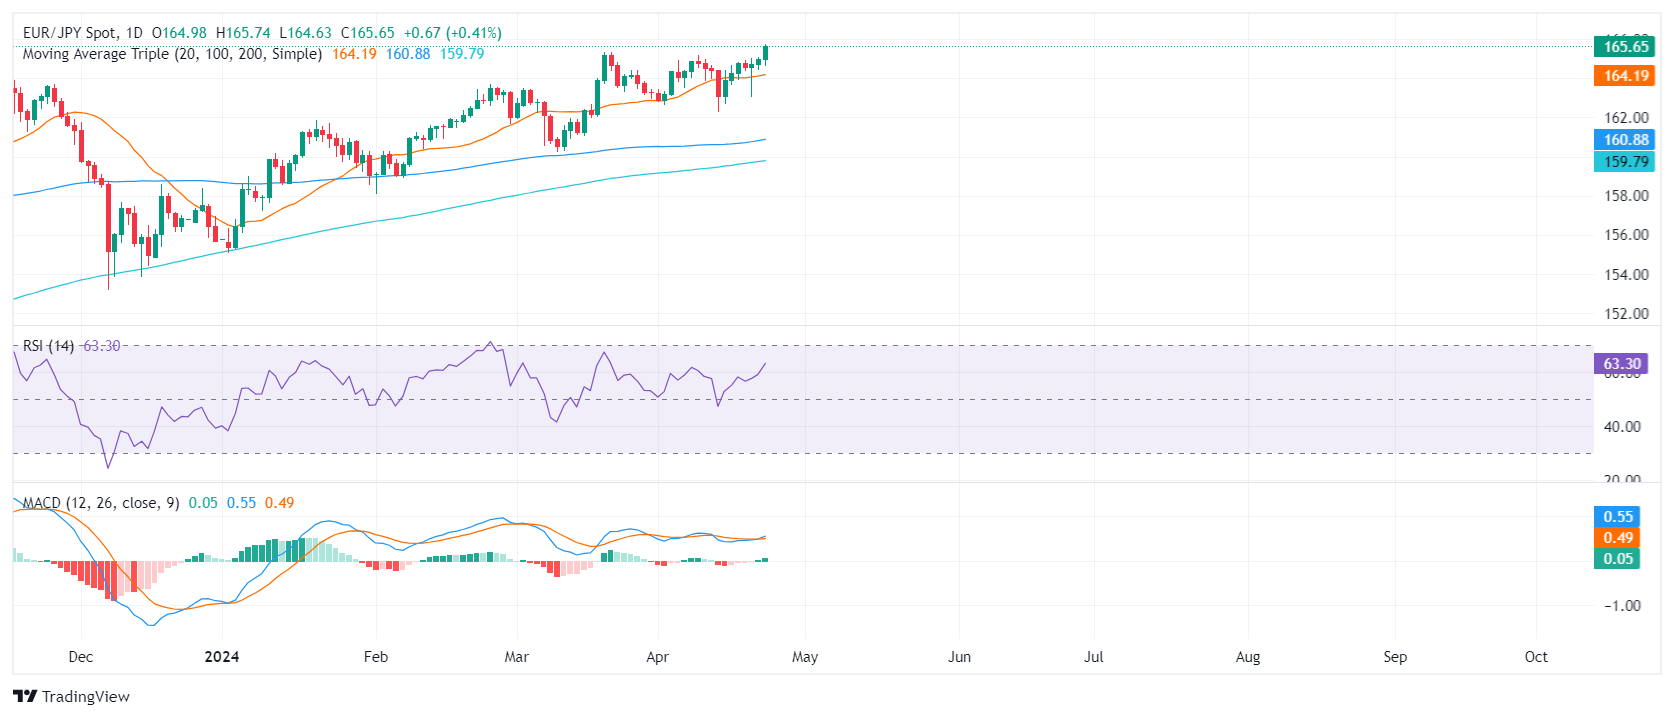
■The daily RSI signals growing buying momentum for the EUR/JPY.


The daily MACD also shows a strengthening buying momentum.
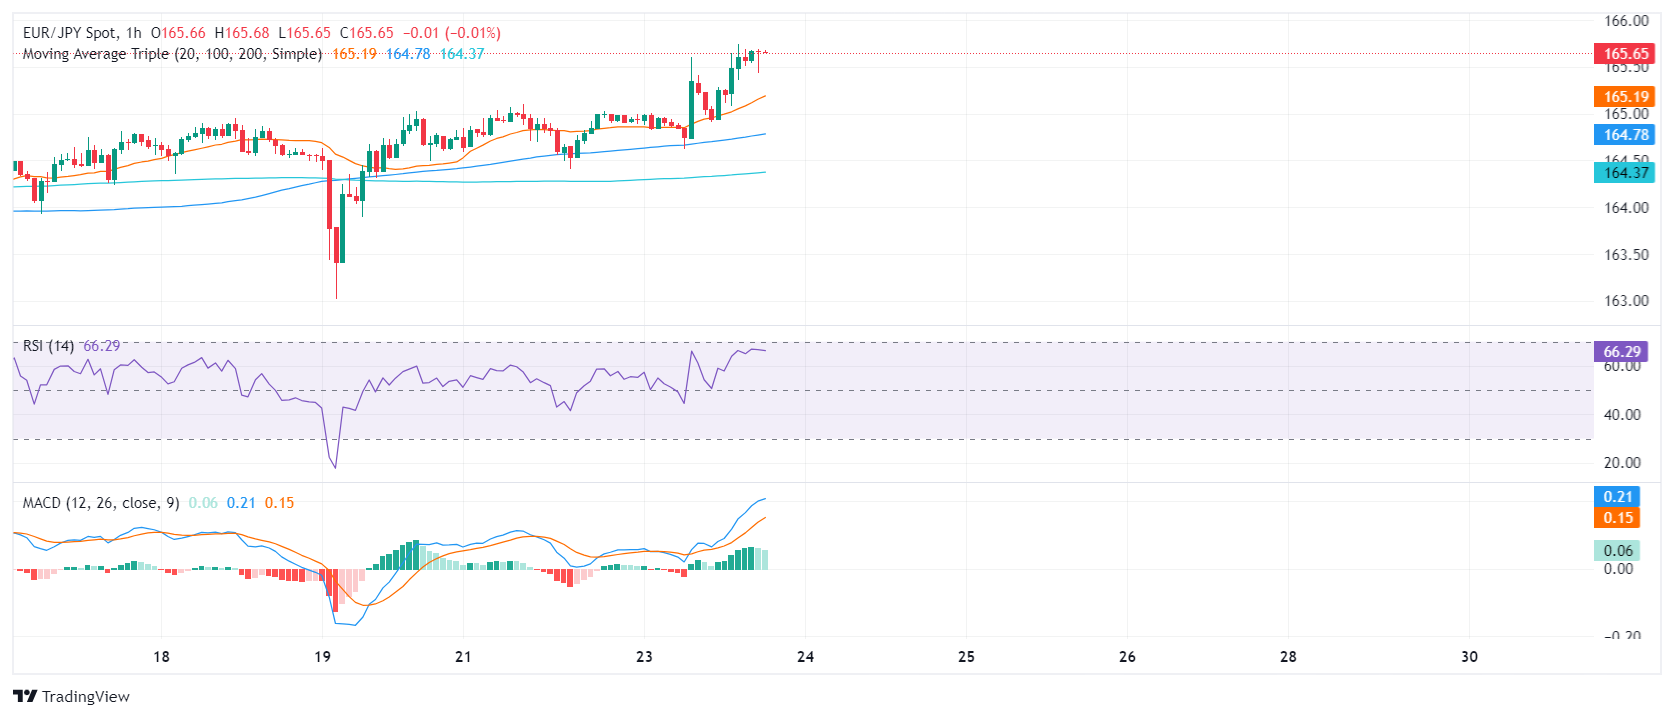

On the hourly chart, the same indicators reveal signs of a more immediate buyer dominance.


The EUR/JPY rose towards 165.64 on Tuesday’s session, its highest level since 2008, showcasing clear bullish signals that point to further gains. With buyers in command, the overall landscape for the pair can be viewed as bullish.


On the daily chart, the Relative Strength Index (RSI) shows an ascending trend for the, moving deep in positive terrain. Concurrently, the Moving Average Convergence Divergence (MACD) backs this outlook as its histogram displays ascending green bars, underscoring the positive momentum.


EUR/JPY daily chart


In contrast, the insight from the hourly chart provides a slightly different perspective. While the RSI also showcases an uptrend into positive territory, the current level was higher than that of the daily chart, hinting at a more immediate upward momentum. Simultaneously, the MACD on the hourly chart strengthens the bullish bias, evident from the rising green bars.


EUR/JPY hourly chart


Observing the broader view, the EUR/JPY  stands above its 20, 100, and 200-day Simple Moving Average (SMA), suggesting a strong bullish trend both in the short and long-term perspectives. Overall, bears show no signs of recovering and as bulls capture fresh multi-year highs, there are no technical signals that threaten the clear bullish trend.


EUR/JPY


Overview

Today last price

165.66

Today Daily Change

0.68

Today Daily Change %

0.41

Today daily open

164.98


Trends

Daily SMA20

164.12

Daily SMA50

163.17

Daily SMA100

160.81

Daily SMA200

159.74


Levels

Previous Daily High

165.1

Previous Daily Low

164.4

Previous Weekly High

165.03

Previous Weekly Low

162.67

Previous Monthly High

165.36

Previous Monthly Low

160.22

Daily Fibonacci 38.2%

164.84

Daily Fibonacci 61.8%

164.67

Daily Pivot Point S1

164.55

Daily Pivot Point S2

164.13

Daily Pivot Point S3

163.85

Daily Pivot Point R1

165.26

Daily Pivot Point R2

165.53

Daily Pivot Point R3

165.96

Read more

  • Pound Sterling slumps as UK inflation falls by more than expected to 3.2%
  • Tesla Stock Hits Record High as Robotaxi Tests Ignite Market. Why Is Goldman Sachs Pouring Cold Water on Tesla?
  • AUD/USD remains depressed below mid-0.6600s; downside seems limited ahead of US NFP report
  • * The content presented above, whether from a third party or not, is considered as general advice only.  This article should not be construed as containing investment advice, investment recommendations, an offer of or solicitation for any transactions in financial instruments.

    goTop
    quote
    Related Articles
    placeholder
    Australian Dollar deepens losses despite rising Consumer Inflation ExpectationsThe Australian Dollar (AUD) loses ground against the US Dollar (USD) on Thursday for the sixth successive day.
    Author  FXStreet
    11 hours ago
    The Australian Dollar (AUD) loses ground against the US Dollar (USD) on Thursday for the sixth successive day.
    placeholder
    Pound Sterling slumps as UK inflation falls by more than expected to 3.2%The Pound Sterling (GBP) faces intense selling pressure against its major currency peers on Wednesday and slides over 0.5% to near 1.3340 against the US Dollar (USD), following the release of the United Kingdom (UK) Consumer Price Index (CPI) data for November.
    Author  FXStreet
    Yesterday 09: 07
    The Pound Sterling (GBP) faces intense selling pressure against its major currency peers on Wednesday and slides over 0.5% to near 1.3340 against the US Dollar (USD), following the release of the United Kingdom (UK) Consumer Price Index (CPI) data for November.
    placeholder
    FX Today: US soft data maintains US Dollar under pressureThe US Dollar Index (DXY) tumbled below 98.00 on Tuesday, reaching its lowest level since mid-October. The Greenback faced intense selling pressure following a delayed labor report that revealed a significant softening in the US job market, overshadowing weak economic activity data from Europe.
    Author  FXStreet
    Yesterday 01: 31
    The US Dollar Index (DXY) tumbled below 98.00 on Tuesday, reaching its lowest level since mid-October. The Greenback faced intense selling pressure following a delayed labor report that revealed a significant softening in the US job market, overshadowing weak economic activity data from Europe.
    placeholder
    AUD/USD remains depressed below mid-0.6600s; downside seems limited ahead of US NFP reportThe AUD/USD pair attracts some sellers for the fourth straight day on Tuesday and trades around the 0.6630 region, down just over 0.10%, during the Asian session.
    Author  FXStreet
    Dec 16, Tue
    The AUD/USD pair attracts some sellers for the fourth straight day on Tuesday and trades around the 0.6630 region, down just over 0.10%, during the Asian session.
    placeholder
    AUD/USD holds steady below 0.6650, highest since September ahead of China's trade dataThe AUD/USD pair enters a bullish consolidation phase at the start of a new week and oscillates in a narrow range near its highest level since September 16, touched on Friday.
    Author  FXStreet
    Dec 08, Mon
    The AUD/USD pair enters a bullish consolidation phase at the start of a new week and oscillates in a narrow range near its highest level since September 16, touched on Friday.

    Forex Related Articles

    • Trading Chart Patterns:Ultimate Guide to Price Action
    • 06 Leading Forex Trading Apps in Australia: Reviews & Download Links
    • Forex Market Hours, Every Forex Trader Cannot Miss
    • Top 10 Must-Have Forex Technical Indicators That Every Trader Should Use
    • 7 Powerful Forex Trading Strategies/Tips for Consistent Profits
    • EUR/USD Forecast In 2024/2025/2026: Which EUR Pairs Should I Buy?

    Click to view more