

EUR/USD Price Analysis: Consolidates around 1.0765-70 area/100-day SMA, US CPI awaited

- Silver Price Forecast: Trump Signals Rapid Progress in US-Iran Negotiations, Bulls Target $90
- Gold declines below $4,500 as Iran tensions stoke inflation fears and bolster Fed hike bets
- Fed’s Powell says credibility lost if President can fire officials
- $1.5 Billion in Crypto Assets Liquidated, Bitcoin Falls Below $66,000 Mark. What Is the Reason?
- Bitcoin Suffers Year’s Strongest Waterfall-Style Decline. Will It Next Drop to the $60,000 Mark?
- WTI rises to near $93.00 as Iran launches missiles toward Kuwait, Bahrain

●EUR/USD remains confined in a narrow trading band for the second straight day.
●The technical setup warrants some caution before placing fresh directional bets.
●Traders now look to the US CPI for fresh impetus amid dovish Fed/ECB pricing.
The EUR/USD pair extends its sideways consolidative price move for the second successive day on Tuesday and remains well within the striking distance of the monthly low, around the 1.0725-1.0720 region touched last week. Spot prices currently trade around the 1.0765-1.0770 area, nearly unchanged for the day, as traders keenly await the release of the US consumer inflation figures for a fresh impetus.
In the run-up to the key data risk, reduced bets for the first interest rate cut by the Federal Reserve (Fed) in March 2024 act as a tailwind for the US Dollar (USD). The shared currency, on the other hand, is undermined by speculations that the European Central Bank (ECB) may start cutting interest rates early next year amid a bigger-than-expected fall in the Eurozone inflation last month. This, in turn, is holding back traders from placing aggressive directional bets around the EUR/USD pair and leading to a subdued range-bound price action.
From a technical perspective, spot prices on Friday showed resilience below the 50% Fibonacci retracement level of the October-November rally and so far, managed to defend the 100-day Simple Moving Average (SMA) on a daily closing basis.
This makes it prudent to wait for a sustained break and acceptance below the 1.0725 region before positioning for an extension of the recent pullback from a multi-month peak touched in November. The EUR/USD pair might then weaken below the 1.0700 mark and test the 61.8% Fibo. level, around the 1.0670-1.0665 zone.
On the flip side, the 1.0800 round figure, coinciding with the 38.2% Fibo. breakpoint, now seems to act as an immediate strong barrier ahead of the 200-day SMA, around the 1.0825 region. Some follow-through buying has the potential to lift the EUR/USD pair back closer to the 1.0900 mark. The momentum could get extended further towards the next relevant hurdle near the 1.0940 horizontal zone, above which bulls could make a fresh attempt to conquer the 1.1000 psychological mark.
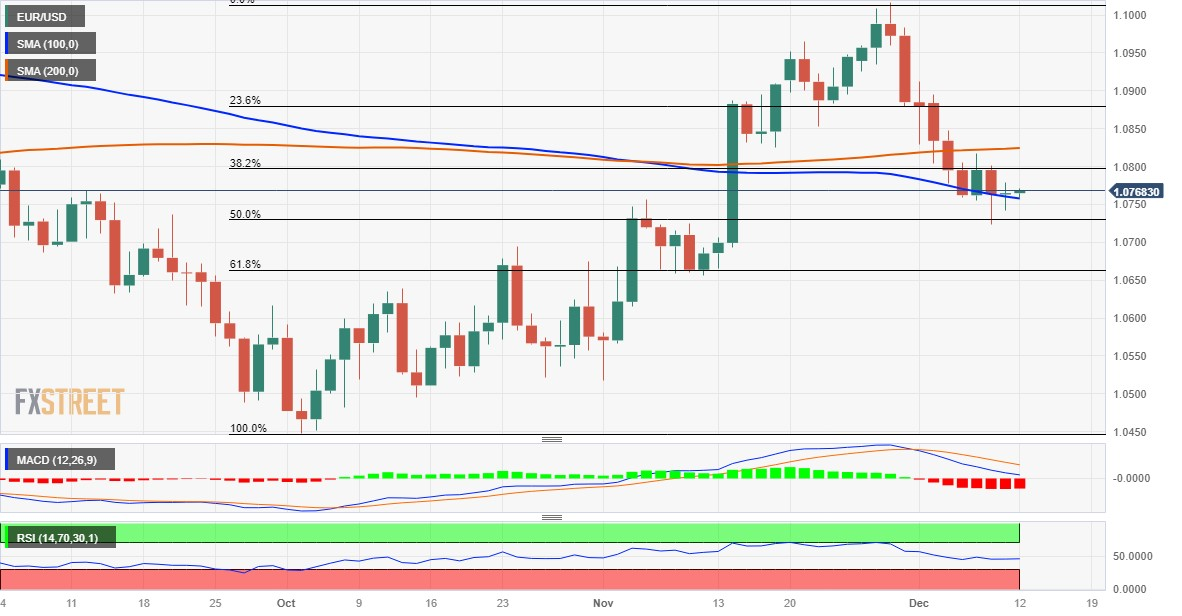
EUR/USD daily chart, Source: TradingView.
* The content presented above, whether from a third party or not, is considered as general advice only. This article should not be construed as containing investment advice, investment recommendations, an offer of or solicitation for any transactions in financial instruments.


