

Sui price tests above $4.00 for the first time since early February, upholding a broad-based bullish momentum.
Sui is crafting a new ecosystem, redefining how builders and users interact with AI, Gaming and DeFi.
Upward-trending moving averages and a MACD buy signal hint at strong bullish momentum targeting new all-time highs.
Sui (SUI) price surges to $4.15 at the time of writing on Monday, reflecting broader risk-on sentiment. The bullish wave across the cryptocurrency market comes amid progressive trade talks between the United States (US) and China, which have seen the world’s largest economies agree to lower tariffs for 90 days.
The US will slash tariffs to 30% from a staggering 145% and China from 125% to 10% in a move believed to have the potential to boost global trade and markets.
The general outlook remains bullish, with SUI exploring highs above $4.00. Major digital assets, including Bitcoin (BTC), reacted positively, crossing above $105,000 at the time of writing. Ripple (XRP) gains momentum, targeting a sharp move to $3.00.
How Sui is redefining AI, gaming and DeFi
Sui is preparing for the “The Great Sui Odyssey #5” event in Vietnam on Saturday. The event focuses on how Sui redefines Artificial Intelligence (AI), gaming, and Decentralized Finance (DeFi) for developers in the ecosystem.
The layer-1 blockchain leverages its scalability to empower builders with fast, secure, and accessible solutions, while enabling innovative applications like Large Language Models (LLMs) through blockchain synergy.
The protocol’s high throughput and dynamic assets enhance engagement and functionality in gaming. Sui’s first quarter DeFi Roundup emphasised the network’s liquidity and performance, driving efficient financial applications.
Sui eyes new all-time highs
Sui’s price is grinding higher at $4.15 at the time of writing, mirroring broader bullish momentum in the market, as investors digest the de-escalation of trade tensions between the US and China.
The Moving Average Convergence Divergence (MACD) indicator supports the uptrend, eyeing a breakout to new all-time highs past Sui’s price in the first quarter at a peak of $5.38. Traders will likely seek exposure to SUI with the MACD line (blue) above the signal line (red).
The 50-day, 100-day, and 200-day Exponential Moving Averages (EMAs) are significantly below the current price, indicating that the shorter-term trend remains bullish. Traders would look for a move above resistance at $4.20 to ascertain the uptrend’s strength towards the record high of $5.38.
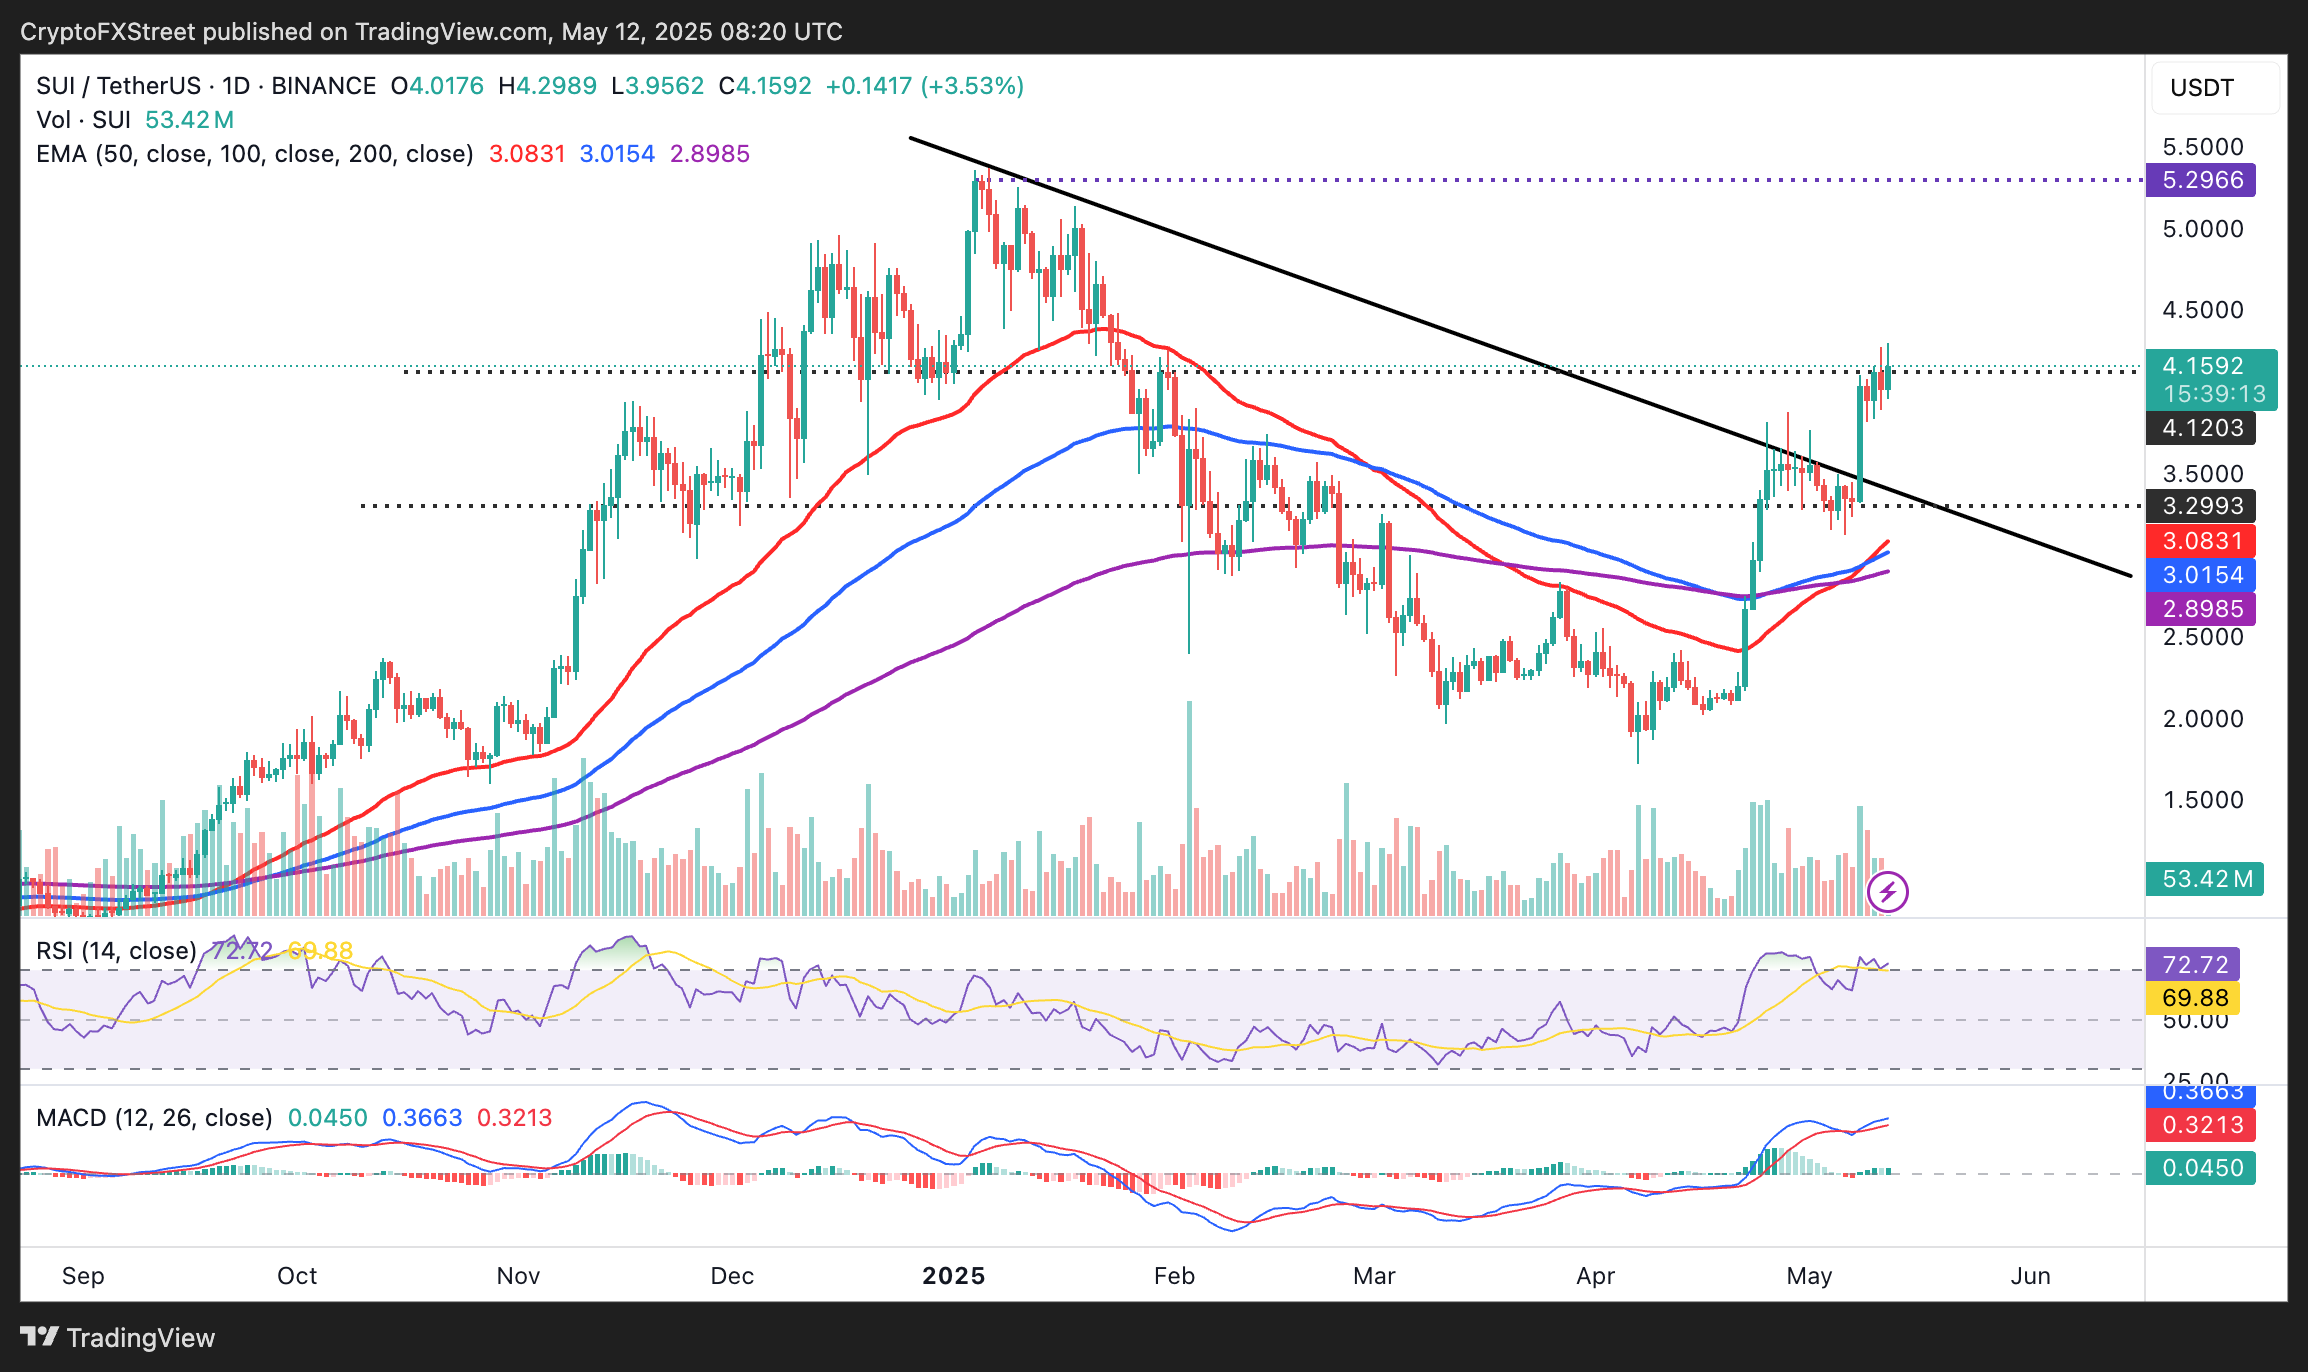
SUI/USD daily chart
Following the massive rally from the April 7 low of $1.71, the Relative Strength Index (RSI) at 72.72, which peaked at 75.5 on Thursday, hints at consolidation or trend weakness.
An RSI reading above 70 highlights overbought conditions, often precursors to pullbacks, as seen with Sui’s drawdown from $3.93 to 2.98 in November, when the indicator topped out at 84. With that in mind, it would be prudent if traders prepared for different outcomes, including a retracement targeting support at the descending trendline and the confluence around $3.00 formed by the 50-day EMA and 100-day EMA.
* The content presented above, whether from a third party or not, is considered as general advice only. This article should not be construed as containing investment advice, investment recommendations, an offer of or solicitation for any transactions in financial instruments.


