
PEPE Price Forecast: PEPE bulls gain traction as Open Interest reaches a new all-time high


Pepe price extends its gains on Monday after rallying nearly 70% in the previous week.
CoinGlass data shows that PEPE’s Open Interest reaches a new all-time high on Monday.
The technical outlook suggests a rally continuation, targeting the $0.000016 level.
Pepe (PEPE) price is extending its gains by 5% at the time of writing on Monday after rallying nearly 70% in the previous week. CoinGlass data shows that PEPE’s open interest reached a new all-time high of $595.36 on Monday, indicating new buying activity among traders. The technical outlook for the frog-themed meme coin suggests a rally continuation, targeting the $0.000016 level.
Pepe’s Open Interest reaches a new all-time high
Coinglass’ data shows that the futures’ OI in PEPE at exchanges rose from $398 million on Thursday to $595.36 million on Monday, a new all-time high. An increasing OI represents new or additional money entering the market and new buying, which could fuel the current PEPE price rally.
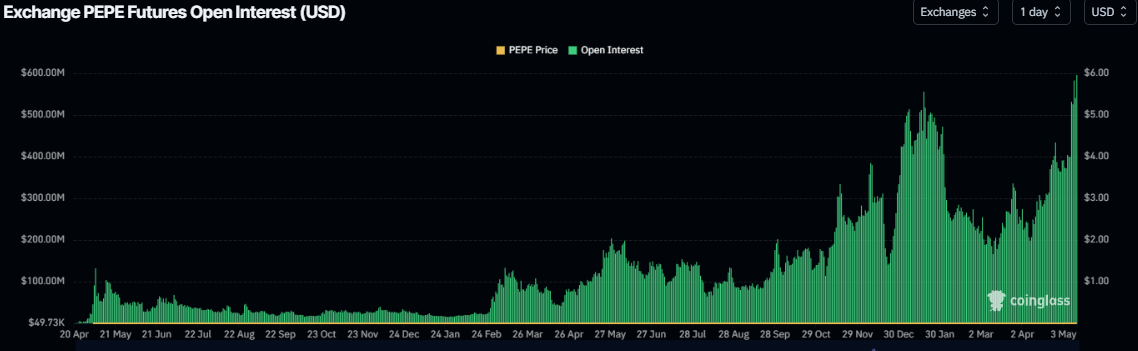
PEPE open interest chart. Source: Coinglass
Another bullish sign is Coinglass’s Pepe long-to-short ratio, which reads 1.09, the highest level in over a month. This ratio above one reflects bullish sentiment in the markets as more traders are betting on the rise of the frog-themed meme coin price.
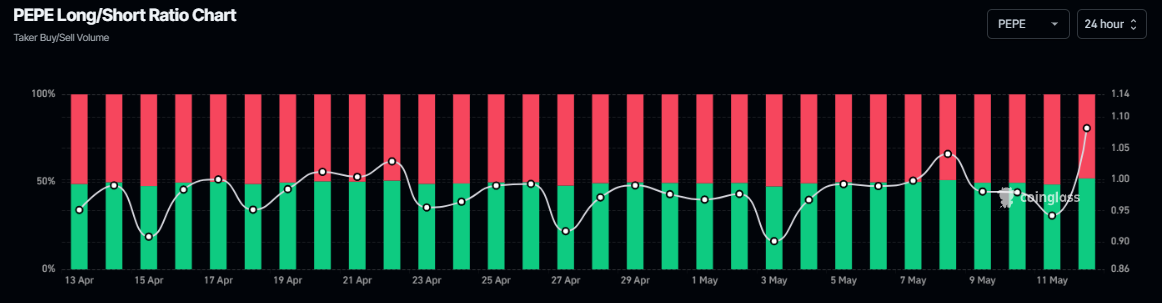
PEPE long-to-short ratio chart. Source: Coinglass
Pepe Price Forecast: Pepe bulls aim for the $0.000016 mark
Pepe price broke and closed above its 100-day Exponential Moving Average (EMA) at $0.000009 on Thursday and rallied over 64% until Saturday and closed above its daily resistance level at $0.000013. However, it faced a pullback the next day, and support was found at this daily level. At the time of writing on Monday, it continues to trade higher by 5% at around $0.000014.
If PEPE continues its upward trend, it could extend the rally to retest its next daily resistance at $0.000016. A successful close above this level will extend an additional gain toward its January 18 high of $0.000021.
The daily chart's Relative Strength Index (RSI) moves above 70, indicating strong bullish momentum. However, traders should be cautious as the chances of a pullback are high due to the overbought condition. Another possibility is that the RSI remains above the overbought level of 70 and continues its upward trend.
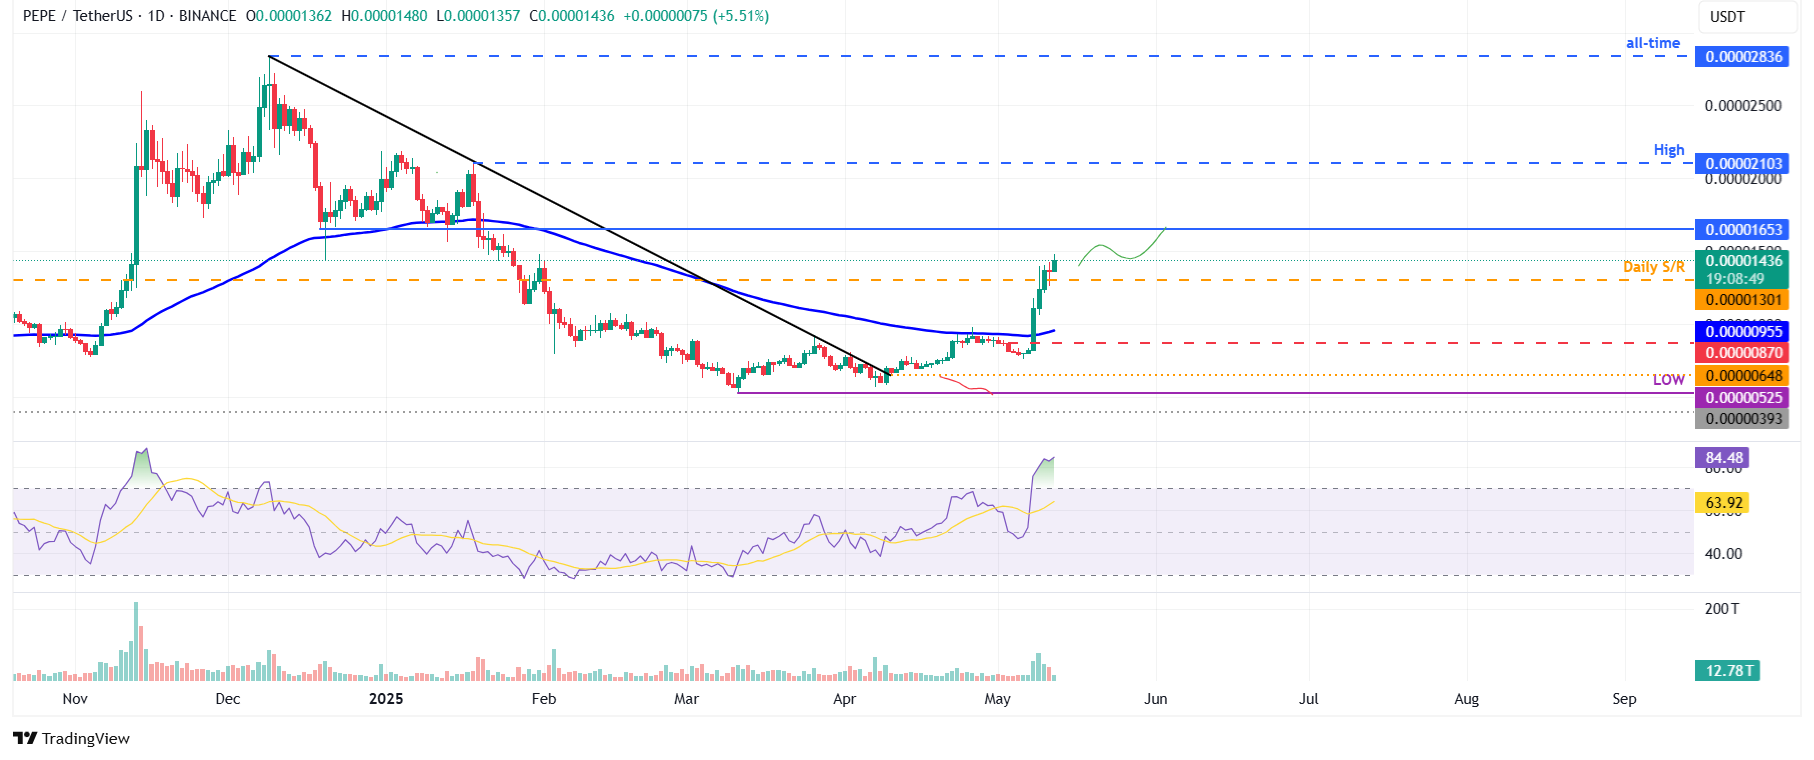
PEPE/USDT daily chart
However, if PEPE faces a pullback, it could extend the decline to retest its next support level at $0.000013.
Read more
* The content presented above, whether from a third party or not, is considered as general advice only. This article should not be construed as containing investment advice, investment recommendations, an offer of or solicitation for any transactions in financial instruments.


