

Uniswap (UNI) Price Soars Over 10% Following Unichain Announcement

- Gold Price Trend Forecast: Why Did Gold Prices Fall After US CPI Cooled? Fed Chair Speech and Iran Situation Become Obstacles
- Gold Price Trend Forecast: June CPI Plus Fed Chair Congressional Testimony, Can Gold Price Hold Above $4,000?
- TradingKey Daily Market Brief: Gold Falls Below $4,000, TSMC’s Strong Earnings Fail to Stop AI Trade Cooling, Chip Stocks Sold Off
- Gold slides back closer to $4,050 as Iran risks and Fed hike bets boost USD
- Gold Price Forecast: Cooling Inflation Fails to Offset Fed Hawkish Pressure, Gold Price May Fall to $3,500
- Today’s Market Recap: Unexpected PPI Drop Boosts Markets, Apple Hits All-Time High, AI Hardware Stocks Remain Under Pressure, Micron, SanDisk Slump

Uniswap (UNI) price raised more than 10% after Uniswap Labs announced the launch of its own Layer-2, Unichain. This surge in price has driven the Relative Strength Index (RSI) to overbought levels, suggesting strong buying momentum.
The rapid increase has brought caution to the market, as overbought conditions may lead to a pullback. Key resistance and support levels will be critical in determining UNI’s next price movements.
UNI RSI Suggests Overbought Conditions
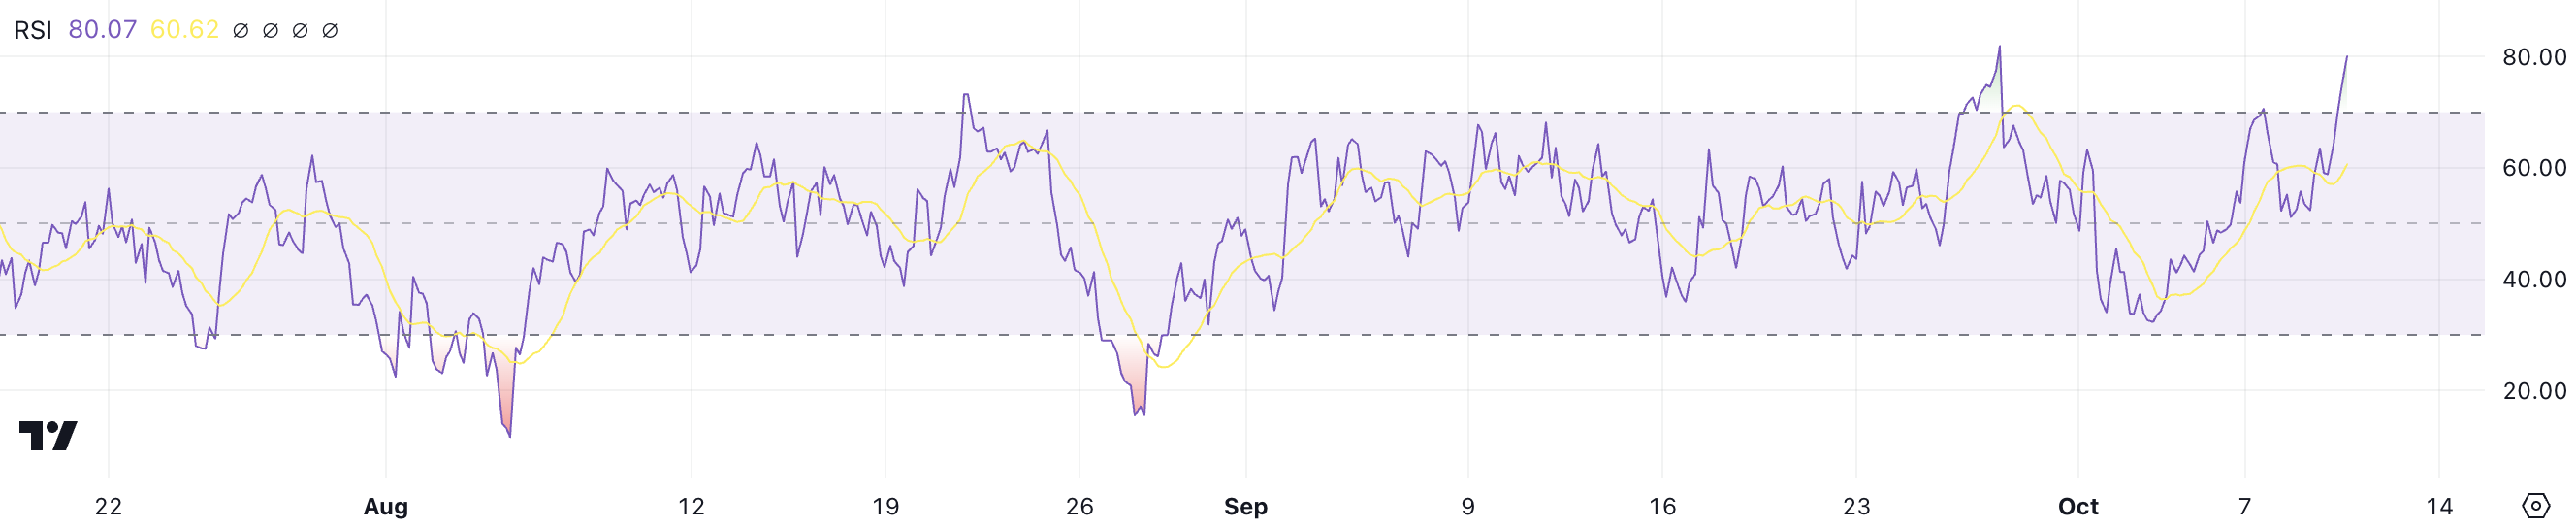
UNI’s RSI is currently at 80, up sharply from 58 in just a few hours after news about Unichain. This quick increase suggests strong buying momentum as investors reacted positively to the news.
RSI, or Relative Strength Index, measures the speed and change of price movements and is used to determine whether an asset is overbought or oversold. It ranges from 0 to 100, with values above 70 indicating overbought conditions and values below 30 signaling oversold conditions.
Read more: How To Buy Uniswap (UNI) and Everything You Need To Know
 UNI RSI. Source: TradingView
With an RSI of 80, UNI has entered an overbought stage, meaning that the recent price surge may have pushed the asset beyond its fair value in the short term. Overbought conditions often imply that a correction or pullback could be imminent as the buying frenzy cools off.
Investors should be cautious, as prices may become more volatile and susceptible to downward pressure if profit-taking begins. The current high RSI level indicates that UNI’s price rapid rally could soon face resistance, potentially leading to a short-term price correction.
Uniswap ADX Indicates Moderate Trend Strength
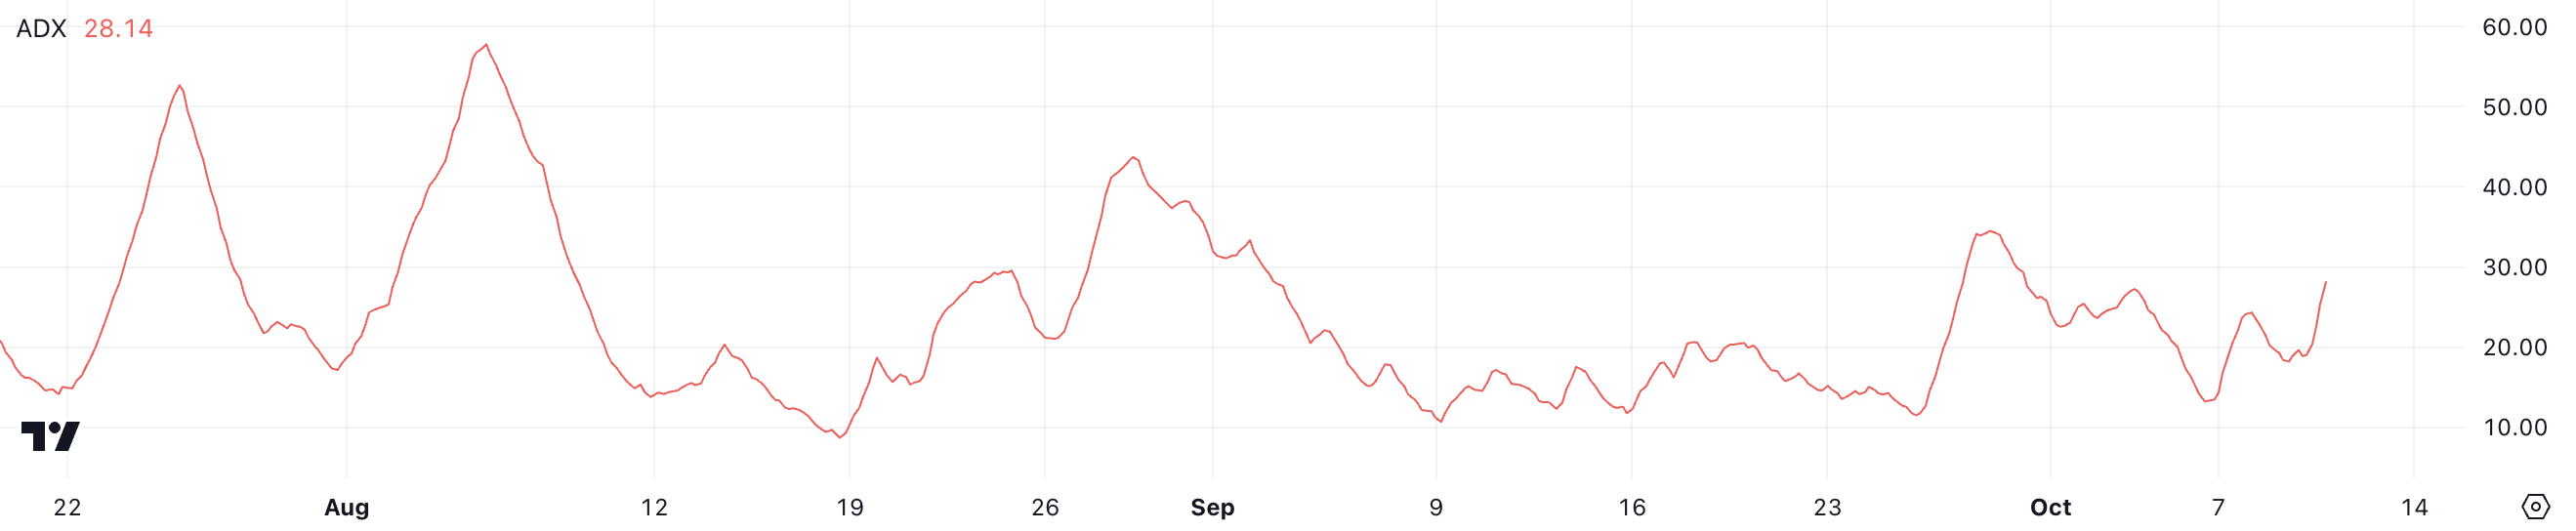
UNI’s ADX is currently at 28, up from 19 in just a few hours. This increase in ADX indicates that the strength of the current trend has been gaining momentum. ADX, or Average Directional Index, measures the strength of a trend, regardless of its direction.
It ranges from 0 to 100, with values above 25 generally indicating a strong trend and values below 20 suggesting a weak or nonexistent trend.
 UNI ADX. Source: TradingView.
Even with ADX at 28, it is still below the levels seen in previous months when both uptrends and downtrends were much stronger. Although UNI’s price increased by over 10% in just a day, the current ADX suggests that the trend may not be as strong as it could be.
This indicates that while there is some momentum, it is not yet at the levels that would imply a sustained or particularly powerful movement. Traders should remain cautious, as the current trend strength might not be enough to prevent a potential reversal or significant volatility in the near term.
UNI Price Prediction: EMA Lines Indicate Potential Uptrend
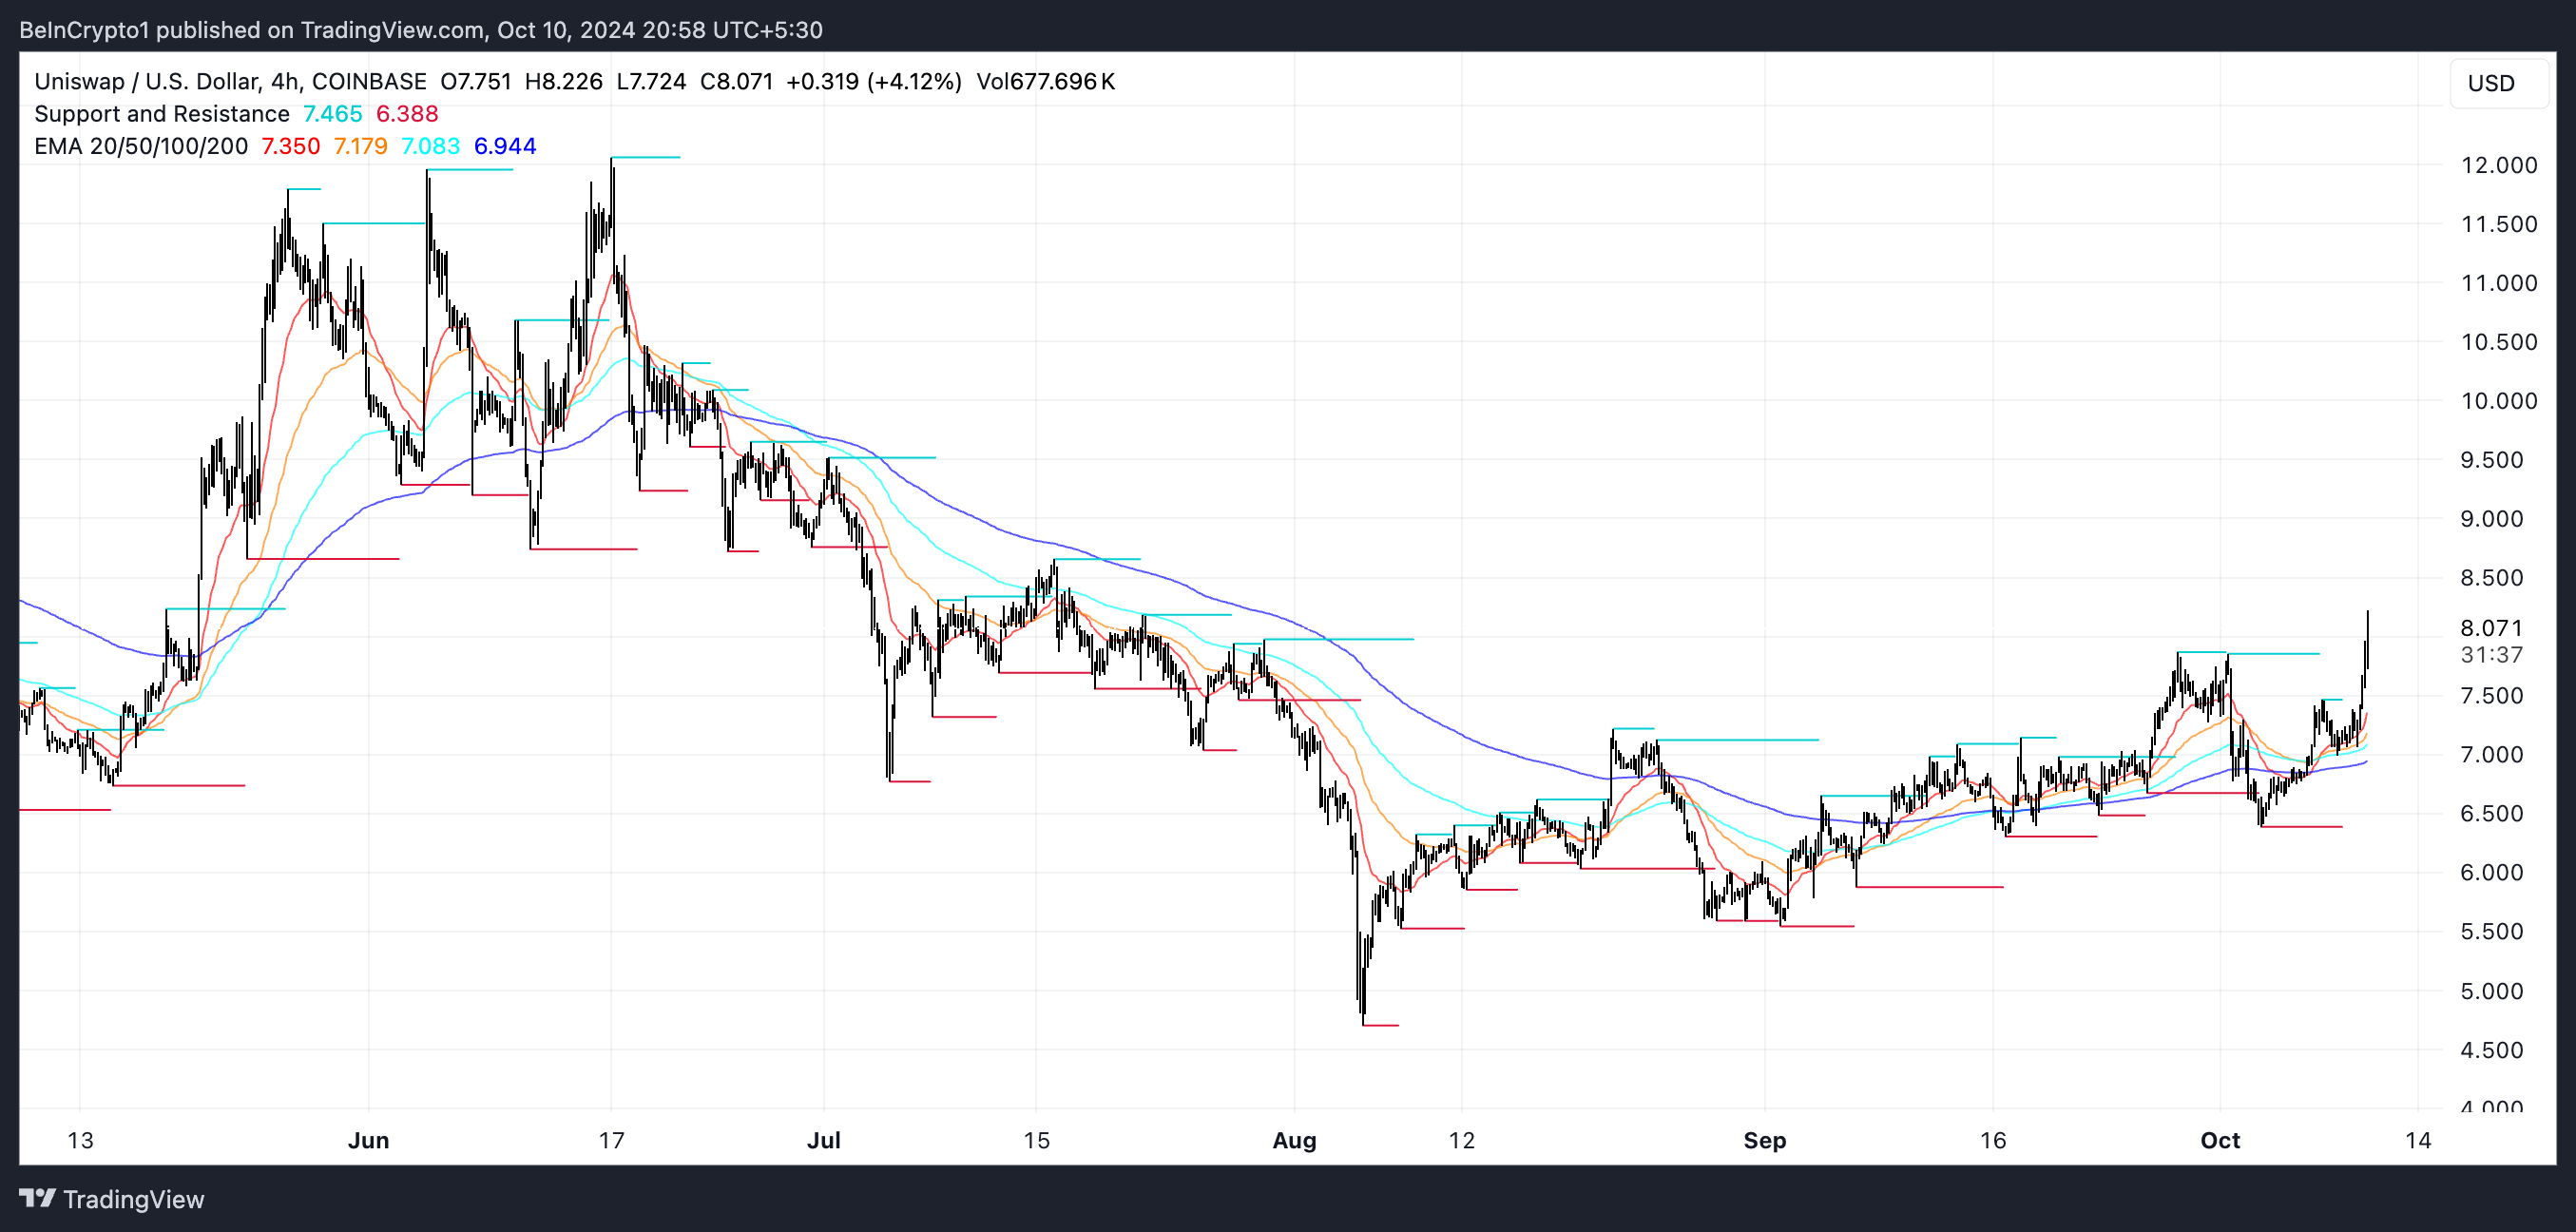
UNI’s EMA lines are currently suggesting a clear uptrend, with the short-term lines positioned above the long-term ones and maintaining a fair distance between them. This configuration typically signals a bullish trend, indicating that recent price action has been favorable.
EMA lines, or Exponential Moving Averages, are a type of moving average that gives more weight to recent prices, making it more responsive to short-term movements. Traders use them to identify ongoing trends and potential reversals by observing the relationship between short-term and long-term moving averages.
Read more: Uniswap (UNI) Price Prediction 2023/2025/2030
 UNI EMA Lines and Support and Resistance. Source: TradingView
However, as the ADX shows, the current trend is not particularly strong despite the bullish EMA pattern. If the uptrend continues and strengthens, UNI’s price could test resistance levels at $8.65 and $9.52. Breaking through these resistances could push the price as high as $12, which would be its highest since June 2024.
On the other hand, if the recent news about Unichain is not enough to sustain momentum and the trend reverses, UNI may test support levels around $7.7 and $7.5, with the possibility of falling as low as $6. That would represent a potential 28% decline.
Read more
* The content presented above, whether from a third party or not, is considered as general advice only. This article should not be construed as containing investment advice, investment recommendations, an offer of or solicitation for any transactions in financial instruments.


