
Dogecoin and Shiba Inu Price Forecast: DOGE and SHIB show early signs of a bullish breakout

Dogecoin and Shiba Inu hold support at key levels, hinting at a potential recovery.
On-chain metrics for both meme coins show positive funding rates and dormant activity, reinforcing the bullish sentiment.
The technical outlook points to possible double-digit gains for both meme coins ahead.
Dogecoin (DOGE) and Shiba Inu (SHIB) show early signs of a potential rally as both meme coins stabilize at key support levels. On-chain metrics for dog-themed meme coins show positive funding rates and dormant activity, reinforcing bullish sentiment. The technical outlook also supports the case for double-digit gains, setting the stage for renewed upward momentum in the dog-themed crypto duo.
Dog-based meme coins show a positive bias
According to Coinglass’s OI-Weighted Funding Rate data, the number of traders betting that the prices of Dogecoin and Shiba Inu meme coins will slide further is lower than that anticipating a price increase.
This index is based on the yields of futures contracts, which are weighted by their Open Interest (OI) rates. Generally, a positive rate (longs pay shorts) indicates bullish sentiment, while negative numbers (shorts pay longs) indicate bearishness.
The metric stands at 0.0094% and 0.0101% for DOGE and SHIB, respectively, reflecting a positive rate and indicating that longs are paying shorts. This scenario often signifies bullish sentiment in the market, suggesting potential upward pressure on DOGE and SHIB prices.
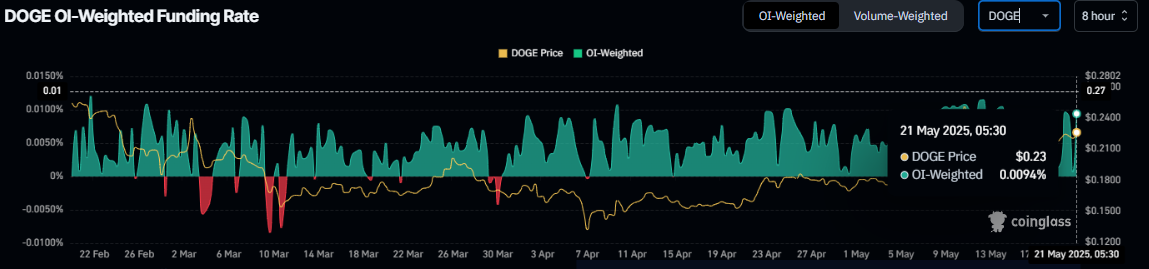
DOGE OI-Weighted Funding Rate chart. Source: Coinglass
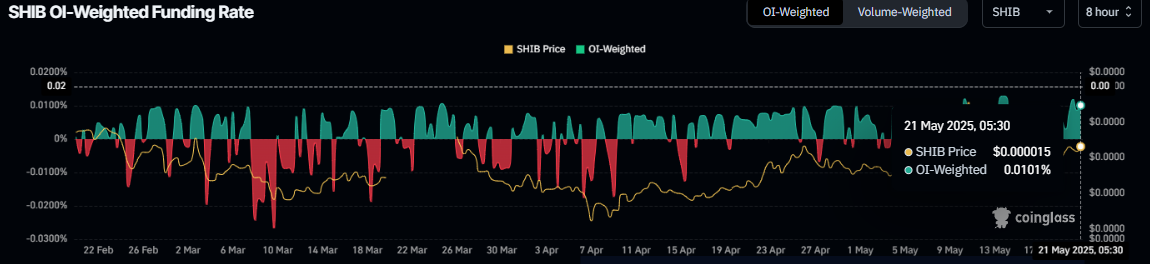
SHIB OI-Weighted Funding Rate chart. Source: Coinglass
On-chain data provider Santiment’s Age Consumed index projects a bullish outlook for these dog-themed memecoins. The spikes in this index suggest dormant tokens (tokens stored in wallets for a long time) are in motion, and it can be used to spot short-term local tops or bottoms.
In the case of DOGE and SHIB, history shows that the spikes were followed by a rise in these memecoin prices as holders. The most recent uptick on Tuesday also forecasted that these dog-themed meme coins were ready for an uptrend.
 [10-1747805764576.12.26, 21 May, 2025].png)
DOGE Age Consumed chart. Source: Santiment
 [10-1747805786086.07.27, 21 May, 2025].png)
SHIB Age Consumed chart. Source: Santiment
Dogecoin Price Forecast: DOGE bulls aim for 20% gains
Dogecoin price has retested multiple times, and support has been found around its 200-day Exponential Moving Average (EMA) at $0.21 since last week. At the time of writing on Wednesday, it trades above this support level at around $0.23.
If the 200-day EMA remains strong, DOGE could extend the rally by 20% from its current trading levels to retest the 50% price retracement level (drawn from the August 2023 low of $0.05 to the December 2024 high of $0.48) at $0.27.
The Relative Strength Index (RSI) on the daily chart reads 61, above its neutral level of 50, indicating bullish momentum.
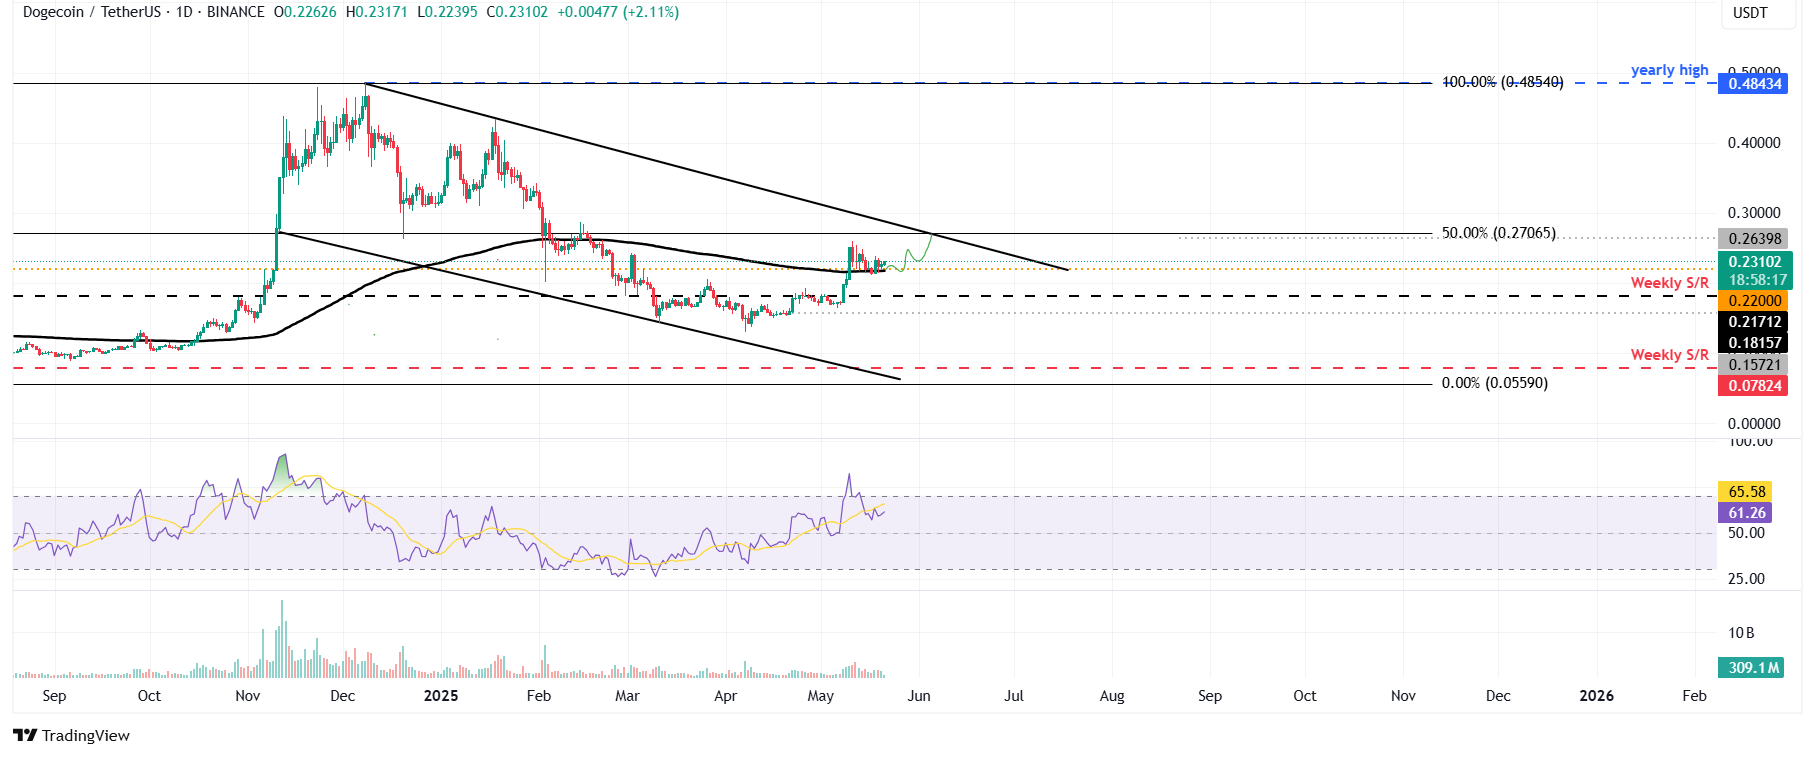
DOGE/USDT daily chart
However, if DOGE breaks and closes below the 200-day EMA at $0.21, it would extend the correction to retest its next weekly support at $0.18.
Shiba Inu Price Forecast: SHIB aims for a 30% rally
Shiba Inu price has been retested, and support has been found around its 50-day EMA at $0.000013 since Saturday, hovering above it for the next three days. This level roughly coincides with the previously broken descending trendline (drawn by connecting multiple highs since mid-December) at $0.000014, making it a key support zone. At the time of writing on Wednesday, it trades at around $0.000014.
If the 50-day EMA remains strong, SHIB could extend the rally by 30% from its current level to retest its next daily resistance at $0.000019.
The RSI on the daily chart reads 61, above its neutral level of 50, indicating bullish momentum.
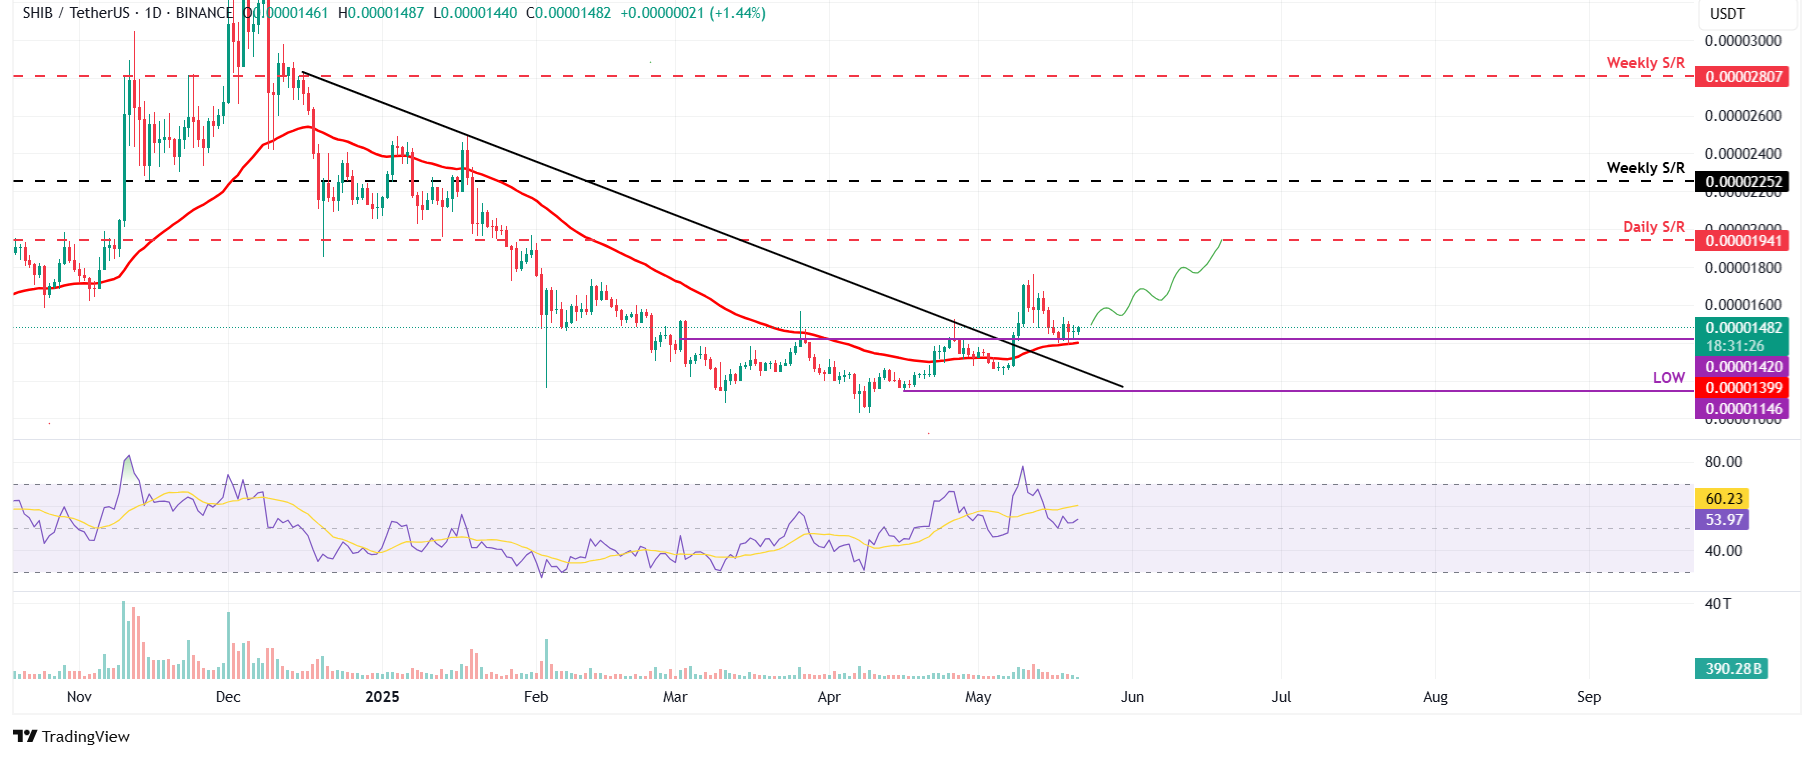
SHIB/USDT daily chart
However, if SHIB closes below $0.000013, it could extend the decline to retest its April 16 low of $0.000011.
* The content presented above, whether from a third party or not, is considered as general advice only. This article should not be construed as containing investment advice, investment recommendations, an offer of or solicitation for any transactions in financial instruments.


