Glassnode’s Bitcoin “Seller Exhaustion” Indicator Just Flashed A Signal: Bottom In?

Mitrade
coverImg
Source: DepositPhotos

A Bitcoin indicator created by the on-chain analytics firm Glassnode has just given a signal that could suggest the exhaustion of selling pressure in the market.

Bitcoin Seller Exhaustion Has Just Registered A Spike

In a new post on X, Glassnode has shared an update on the Seller Exhaustion Composite for the Weekly-Monthly Bitcoin traders. The “Seller Exhaustion Composite” here refers to an indicator that basically identifies whether selling on the network has reached a state of exhaustion or not.

The metric bases itself on a few on-chain indicators, with perhaps the most notable being the Realized Loss, which measures the total amount of loss that the BTC investors are locking in.

Historically, the cryptocurrency’s price has tended to form bottoms whenever holder capitulation has reached a high. In such loss-taking events, coins transfer from the weak hands to the resolute entities, so the risk of further selling reduces, allowing for the asset to find a rebound.

In the context of the current topic, the Seller Exhaustion Composite of only the Weekly-Monthly BTC traders is of interest. These are the investors who purchased their coins between one day and one month ago. The reason Glassnode has picked this specific cohort is that there is a statistical relationship between holding time and the tendency to sell. The HODLers of the market carry their coins for long periods and, therefore, aren’t very likely to participate in selling at any point. The only times that these diamond hands are forced into capitulation are the major cyclical downturns.

On the other hand, the investors who are relatively fresh buyers can be prone to panic selling, so loss taking from them can appear in all phases of the cycle, even the bull market.

Now, here is the chart shared by the analytics firm that shows the trend in the Bitcoin Seller Exhaustion Composite for new buyers in the market:
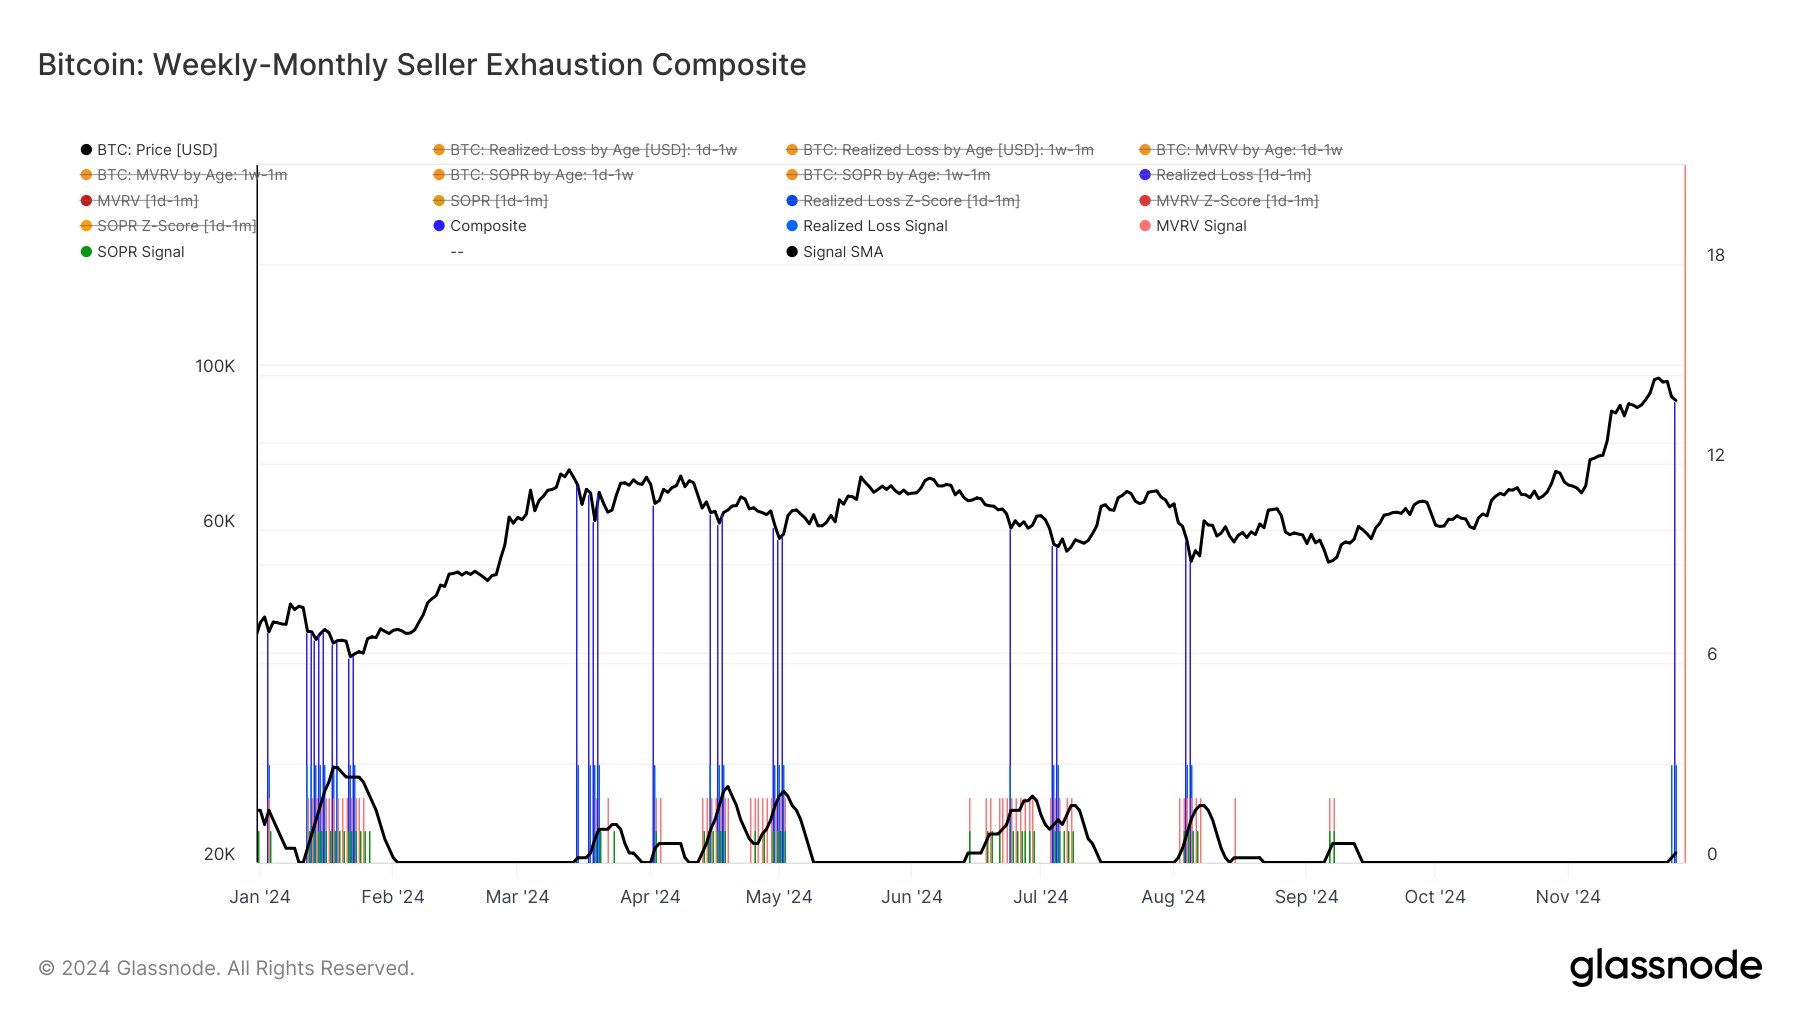
Bitcoin Seller Exhaustion Composite

As displayed in the above graph, the Seller Exhaustion Composite has just flashed a signal for the Bitcoin Weekly-Monthly traders. “This reflects high locked-in losses from BTC traders active in the last month,” notes Glassnode.

The latest round of capitulation from these recent buyers has come as the cryptocurrency’s price has seen a tumble after its all-time high (ATH) above the $99,000 level.

From the chart, it’s visible that the instances of high loss taking from this cohort all coincided with some sort of bottom in the price during the past year. Given this pattern, it’s possible that Bitcoin may be able to find another bottom off the back of the capitulation this time as well.

BTC Price

Bitcoin had slipped all the way down towards $90,000 a couple of days back, but the coin seems to have made some recovery as it’s now floating around $95,400.

Bitcoin Price

Read more

  • Spot Gold Breaches Four Key Levels, Putting $3,500 at Risk as Technicals Enter Oversold Alert Zone
  • Australian Dollar falls below 0.6700 as Unemployment Rate jumps to the highest level in five years
  • * The content presented above, whether from a third party or not, is considered as general advice only.  This article should not be construed as containing investment advice, investment recommendations, an offer of or solicitation for any transactions in financial instruments.

    goTop
    quote
    Related Articles
    placeholder
    Bitcoin Plunges 13% in a Week as Market Retreats to $60,000 LevelBitcoin plunged 13% over the past seven days as bullish defense lines crumbled in succession, officially kicking off the battle to defend the $60,000 mark.On November 16, following a viol
    Author  TradingKey
    Nov 16, Mon
    Bitcoin plunged 13% over the past seven days as bullish defense lines crumbled in succession, officially kicking off the battle to defend the $60,000 mark.On November 16, following a viol
    placeholder
    Bitcoin lost its 200-day average — but the exit started three sessions before the CPIBitcoin fell 2.5% to about $73,400 on 11 November, an 11-week low, breaking its 200-day moving average near $73,100. The 24-hour liquidation tally reached $632 to $705 million, roughly 82% of it longs. But spot ETF outflows began three sessions earlier and USDT's market cap has shrunk $6.6 billion in 60 days — the leveraged length left before the inflation print did. A double top at 81,890 and 81,080 leaves a measured target of 69,366.
    Author  Suzie
    Nov 11, Wed
    Bitcoin fell 2.5% to about $73,400 on 11 November, an 11-week low, breaking its 200-day moving average near $73,100. The 24-hour liquidation tally reached $632 to $705 million, roughly 82% of it longs. But spot ETF outflows began three sessions earlier and USDT's market cap has shrunk $6.6 billion in 60 days — the leveraged length left before the inflation print did. A double top at 81,890 and 81,080 leaves a measured target of 69,366.
    placeholder
    Bitcoin ETFs sold $1.28 billion in a week — and BTC is still above 75,000US spot Bitcoin ETFs logged $1.28 billion of net outflows in the week to Nov 6, the largest since late June, with BlackRock's IBIT accounting for $1.21 billion. Yet BTC only fell from $80,405 to $74,940, a 6.8% move. The gap between the fund flow and the price is the story: leveraged longs were flushed, but spot holders did not follow the ETFs out — and $75,000 is the line that decides whether that reading holds.
    Author  Suzie
    Nov 09, Mon
    US spot Bitcoin ETFs logged $1.28 billion of net outflows in the week to Nov 6, the largest since late June, with BlackRock's IBIT accounting for $1.21 billion. Yet BTC only fell from $80,405 to $74,940, a 6.8% move. The gap between the fund flow and the price is the story: leveraged longs were flushed, but spot holders did not follow the ETFs out — and $75,000 is the line that decides whether that reading holds.
    placeholder
    Binance replaced 95% of a $6.3bn hole — Bitcoin is trading the plumbing, not the coinBinance resumed withdrawals on November 1 after a record $6.3bn theft. In the first 9.5 hours, users withdrew $4.64bn and deposited $1.01bn, a net outflow of $3.64bn, or 2.1% of assets. Bitcoin fell to 76,173 and is now 78,473. The market is pricing the exchange, not the supply.
    Author  Suzie
    Nov 02, Mon
    Binance resumed withdrawals on November 1 after a record $6.3bn theft. In the first 9.5 hours, users withdrew $4.64bn and deposited $1.01bn, a net outflow of $3.64bn, or 2.1% of assets. Bitcoin fell to 76,173 and is now 78,473. The market is pricing the exchange, not the supply.
    placeholder
    Bitcoin is back above $80,000 — but 75% of the bounce was shorts, not buyersBitcoin trades at $80,669, back above the $80,000 line after touching $79,145 on October 24. But 75.4% of the last 24 hours of futures liquidations were shorts, CME open interest fell 36,545 BTC in October, and spot ETFs lost $773.5 million on October 22-23. Price is up; positioning is down. Here is why the bounce is a squeeze, and the four things that would make it real.
    Author  Suzie
    Oct 28, Wed
    Bitcoin trades at $80,669, back above the $80,000 line after touching $79,145 on October 24. But 75.4% of the last 24 hours of futures liquidations were shorts, CME open interest fell 36,545 BTC in October, and spot ETFs lost $773.5 million on October 22-23. Price is up; positioning is down. Here is why the bounce is a squeeze, and the four things that would make it real.
    Live Quotes
    Name / SymbolChart% Change / Price
    BTCUSD
    BTCUSD
    0.00%0.00
    ETHUSD
    ETHUSD
    0.00%0.00
    DOGEUSD
    DOGEUSD
    0.00%0.00
    SOLUSD
    SOLUSD
    0.00%0.00
    BCHUSD
    BCHUSD
    0.00%0.00
    AAVEUSD
    AAVEUSD
    0.00%0.00

    Bitcoin Related Articles

    • Bitcoin Leverage And Margin Trading in 2026: The Ultimate Beginner's Guide
    • Gold vs Bitcoin 2026: Which Is the Better Investment?Best Hedge Asset Comparison
    • Best Strategies When BTC Price Drops: From Hedging to Accumulating
    • How to Day Trade Crypto? Simplest Day Trading Strategy Ever
    • Bitcoin Price Prediction 2026-2030: Long-Term Outlook Driven by Data & Macro Cycles
    • Bitcoin Mining Beginner Guide: What Is Bitcoin Mining and How to Mine Bitcoin?

    Click to view more