Last Week’s Crypto Inflows Surge to $1.35 Billion: Which Digital Asset Led the Charge?

Mitrade
coverImg
Source: Shutterstock

The global crypto investment market has witnessed a significant influx of capital, with recent reports indicating a continued positive trend in inflows. According to the latest data from CoinShares, digital asset investment products have seen an additional $1.35 billion in net inflows last week.


This recent injection of funds has brought the total for the current positive streak to $3.2 billion. The fact that money has been flowing to this extent is a testament to the amount of steam behind recent market sentiment and confidence among investors regarding cryptocurrencies.


According to Coinshares, this inflow trend is not isolated to one particular cryptocurrency but is rather widespread across various digital assets.


The report reveals that major asset managers such as Ark Invest, Bitwise, BlackRock, Fidelity, Grayscale, ProShares, and 21Shares have all reported substantial inflows.


Which Crypto Asset Led The Charge?


Unsurprisingly, most investments still flow into Bitcoin, with decent contributions from Ethereum and other altcoins.


According to the report, Bitcoin registered roughly $1.27 billion of inflows last week, with short-Bitcoin exchange-traded products (ETPs) seeing further outflows of $1.9 million, bringing outflows since March to US$44 million.


Notably, the transaction volume spurred so far has contributed to a 45% week-over-week increase in ETP trading volumes, representing 22% of the broader crypto market’s total trading volumes.


Aside from Bitcoin’s continuous dominance, Ethereum’s recent performance relative to other altcoins has also been noteworthy.
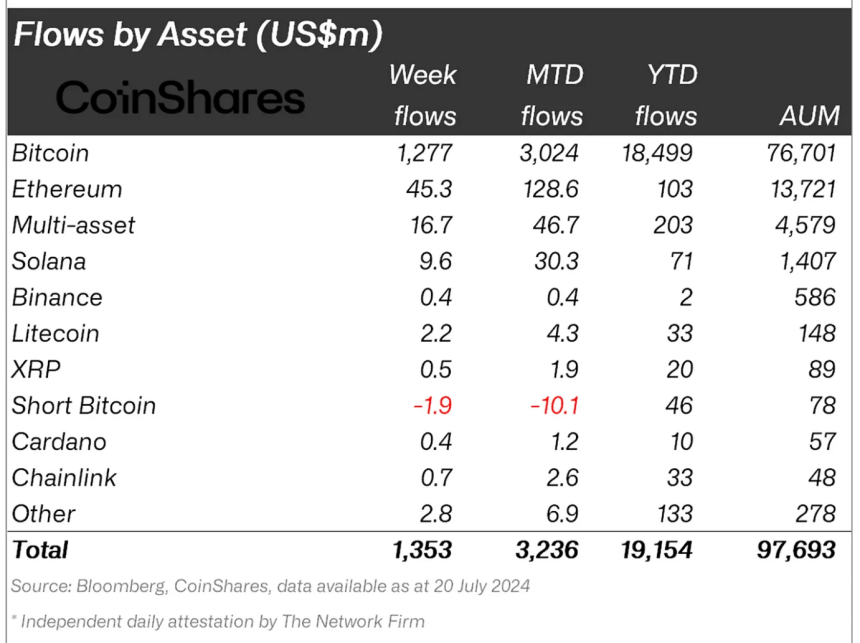
Crypto asset fund flows

James Butterfill, Head of Research at CoinShares, noted a turning point in investor portfolio allocation, with Ethereum overtaking Solana for net inflows year-to-date. Butterfill noted:

The outlook for Ethereum seems to have turned a corner, seeing a further US$45m of inflows last week, overtaking Solana for the altcoin with the most inflows year-to-date (YTD) at US$103m. Solana also saw inflows last week totalling US$9.6m, but now lags Ethereum with US$71m inflows YTD.


This change can be seen as important since it suggests a larger market rotation where investors may be re-aligning their portfolios with Ethereum as it continues to see potential strong long-term growth prospects, such as the upcoming launch of its spot exchange-traded funds (ETFs).


Furthermore, investment flows have also varied significantly across regions. While the US and Switzerland top the table by a margin, there were only small net outflows from Brazil and Hong Kong.
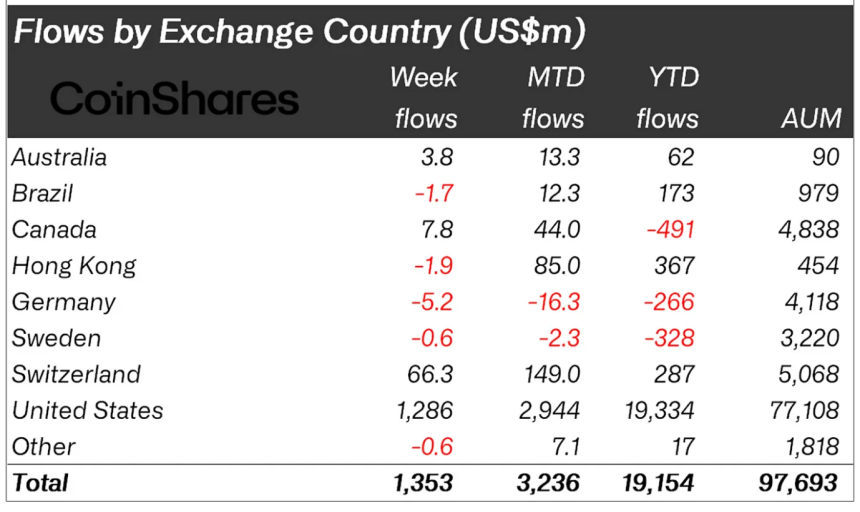
Crypto asset fund flows by region


Market Performance Over The Past Week


While the crypto market fund flows have been positive in the past week, the global price performance also appears to have mirrored this positiveness. Over the past week, the global crypto market valuation has surged from $2.4 trillion to $2.6 trillion.


This increase comes against the backdrop of Bitcoin seeing a notable recovery that brought its price to trade as high as above $68,000 earlier today before now trading below $67,000 at the time of writing.

Bitcoin (BTC) price chart on TradingView

Ethereum and Solana, on the other hand, have also managed to see a recovery in price, just like Bitcoin. Interestingly, although Ethereum seems to be overtaking Solana in fund flows, SOL refuses to accept defeat regarding price performance.


Particularly, according to data, between these two assets, SOL has been the top gainer over the past week, up by 16.8%, a significant difference compared to ETH’s mere 2.6% surge over the same period.

Read more

  • Today’s Market Recap: Nvidia Drops Over 4% After Jensen Huang Resigns, AMD and Broadcom Both Rise Over 5%
  • Gold hit a one-year low while central banks bought 321 tonnes — the sellers were never the ones you think
  • * The content presented above, whether from a third party or not, is considered as general advice only.  This article should not be construed as containing investment advice, investment recommendations, an offer of or solicitation for any transactions in financial instruments.

    goTop
    quote
    Related Articles
    placeholder
    Bitcoin lost its 200-day average — but the exit started three sessions before the CPIBitcoin fell 2.5% to about $73,400 on 11 November, an 11-week low, breaking its 200-day moving average near $73,100. The 24-hour liquidation tally reached $632 to $705 million, roughly 82% of it longs. But spot ETF outflows began three sessions earlier and USDT's market cap has shrunk $6.6 billion in 60 days — the leveraged length left before the inflation print did. A double top at 81,890 and 81,080 leaves a measured target of 69,366.
    Author  Suzie
    Nov 11, Wed
    Bitcoin fell 2.5% to about $73,400 on 11 November, an 11-week low, breaking its 200-day moving average near $73,100. The 24-hour liquidation tally reached $632 to $705 million, roughly 82% of it longs. But spot ETF outflows began three sessions earlier and USDT's market cap has shrunk $6.6 billion in 60 days — the leveraged length left before the inflation print did. A double top at 81,890 and 81,080 leaves a measured target of 69,366.
    placeholder
    Bitcoin ETFs sold $1.28 billion in a week — and BTC is still above 75,000US spot Bitcoin ETFs logged $1.28 billion of net outflows in the week to Nov 6, the largest since late June, with BlackRock's IBIT accounting for $1.21 billion. Yet BTC only fell from $80,405 to $74,940, a 6.8% move. The gap between the fund flow and the price is the story: leveraged longs were flushed, but spot holders did not follow the ETFs out — and $75,000 is the line that decides whether that reading holds.
    Author  Suzie
    Nov 09, Mon
    US spot Bitcoin ETFs logged $1.28 billion of net outflows in the week to Nov 6, the largest since late June, with BlackRock's IBIT accounting for $1.21 billion. Yet BTC only fell from $80,405 to $74,940, a 6.8% move. The gap between the fund flow and the price is the story: leveraged longs were flushed, but spot holders did not follow the ETFs out — and $75,000 is the line that decides whether that reading holds.
    placeholder
    Binance replaced 95% of a $6.3bn hole — Bitcoin is trading the plumbing, not the coinBinance resumed withdrawals on November 1 after a record $6.3bn theft. In the first 9.5 hours, users withdrew $4.64bn and deposited $1.01bn, a net outflow of $3.64bn, or 2.1% of assets. Bitcoin fell to 76,173 and is now 78,473. The market is pricing the exchange, not the supply.
    Author  Suzie
    Nov 02, Mon
    Binance resumed withdrawals on November 1 after a record $6.3bn theft. In the first 9.5 hours, users withdrew $4.64bn and deposited $1.01bn, a net outflow of $3.64bn, or 2.1% of assets. Bitcoin fell to 76,173 and is now 78,473. The market is pricing the exchange, not the supply.
    placeholder
    Bitcoin is back above $80,000 — but 75% of the bounce was shorts, not buyersBitcoin trades at $80,669, back above the $80,000 line after touching $79,145 on October 24. But 75.4% of the last 24 hours of futures liquidations were shorts, CME open interest fell 36,545 BTC in October, and spot ETFs lost $773.5 million on October 22-23. Price is up; positioning is down. Here is why the bounce is a squeeze, and the four things that would make it real.
    Author  Suzie
    Oct 28, Wed
    Bitcoin trades at $80,669, back above the $80,000 line after touching $79,145 on October 24. But 75.4% of the last 24 hours of futures liquidations were shorts, CME open interest fell 36,545 BTC in October, and spot ETFs lost $773.5 million on October 22-23. Price is up; positioning is down. Here is why the bounce is a squeeze, and the four things that would make it real.
    placeholder
    Bitcoin's double top at $88,000: why $78,000 is the line that decides the next moveBitcoin trades near $82,500 (+0.47%) after twice failing at the $88,000 area, forming a potential double top with a neckline at $78,000. A break below the neckline would project a measured target near $68,200; a close back above $88,000 would invalidate the pattern. Here are the structure, the levels and what would confirm either side.
    Author  Suzie
    Oct 19, Mon
    Bitcoin trades near $82,500 (+0.47%) after twice failing at the $88,000 area, forming a potential double top with a neckline at $78,000. A break below the neckline would project a measured target near $68,200; a close back above $88,000 would invalidate the pattern. Here are the structure, the levels and what would confirm either side.
    Live Quotes
    Name / SymbolChart% Change / Price
    BTCUSD
    BTCUSD
    0.00%0.00
    ETHUSD
    ETHUSD
    0.00%0.00
    DOGEUSD
    DOGEUSD
    0.00%0.00
    SOLUSD
    SOLUSD
    0.00%0.00
    BCHUSD
    BCHUSD
    0.00%0.00
    AAVEUSD
    AAVEUSD
    0.00%0.00

    Bitcoin Related Articles

    • Bitcoin Leverage And Margin Trading in 2026: The Ultimate Beginner's Guide
    • Gold vs Bitcoin 2026: Which Is the Better Investment?Best Hedge Asset Comparison
    • Best Strategies When BTC Price Drops: From Hedging to Accumulating
    • How to Day Trade Crypto? Simplest Day Trading Strategy Ever
    • Bitcoin Price Prediction 2026-2030: Long-Term Outlook Driven by Data & Macro Cycles
    • Bitcoin Mining Beginner Guide: What Is Bitcoin Mining and How to Mine Bitcoin?

    Click to view more