

Top 3 Price Prediction: Bitcoin, Ethereum, Ripple – BTC, ETH, XRP slip as resistance levels hold firm

- Bitcoin Drops to $70,000. U.S. Government Refuses to Bail Out Market, End of Bull Market or Golden Pit?
- Gold rallies further beyond $5,050 amid flight to safety, dovish Fed expectations
- Bitcoin Bottom Debate: $70,000 or $50,000?
- A Crash After a Surge: Why Silver Lost 40% in a Week?
- Bitcoin Slips Below 75,000 Mark. Will Strategy Change Its Mind and Sell?
- Bitcoin Rout. Bridgewater Founder Dalio Publicly Backs Gold.

Bitcoin price trades in red on Wednesday after facing rejection from its resistance level at $116,000.
Ethereum price extends its decline after failing to breach the daily resistance at $3,730.
Ripple’s XRP falls below $3, signaling weakness and a potential continuation of its ongoing downtrend.
Bitcoin (BTC) trades in red below $114,000 at the time of writing on Wednesday, following a rejection from its key resistance level earlier this week. Ethereum (ETH) and Ripple (XRP) followed BTC’s footsteps and faced rejection from their critical resistance zones, raising the risk of further declines in the short term.
Bitcoin faces rejection from its $116,000 resistance
Bitcoin price found support around its 50-day Exponential Moving Average (EMA) at $113,058 on Sunday and recovered slightly until the next day, nearing its lower consolidation at $116,000. However, on Tuesday, it faced a mild correction around the $116,000 resistance. At the time of writing on Wednesday, it continues to trade below $114,000.
If the 50-day EMA at $113,058 fails to hold as support, BTC closes below the previous all-time high of $111,980 on a daily basis. Then, it could extend the decline to retest its key psychological support at $110,000.
The Relative Strength Index (RSI) on the daily chart reads 44, after facing rejection from its neutral level of 50, indicating bearish momentum is gaining traction. The Moving Average Convergence Divergence (MACD) showed a bearish crossover on July 23 that still holds, indicating bearish momentum.
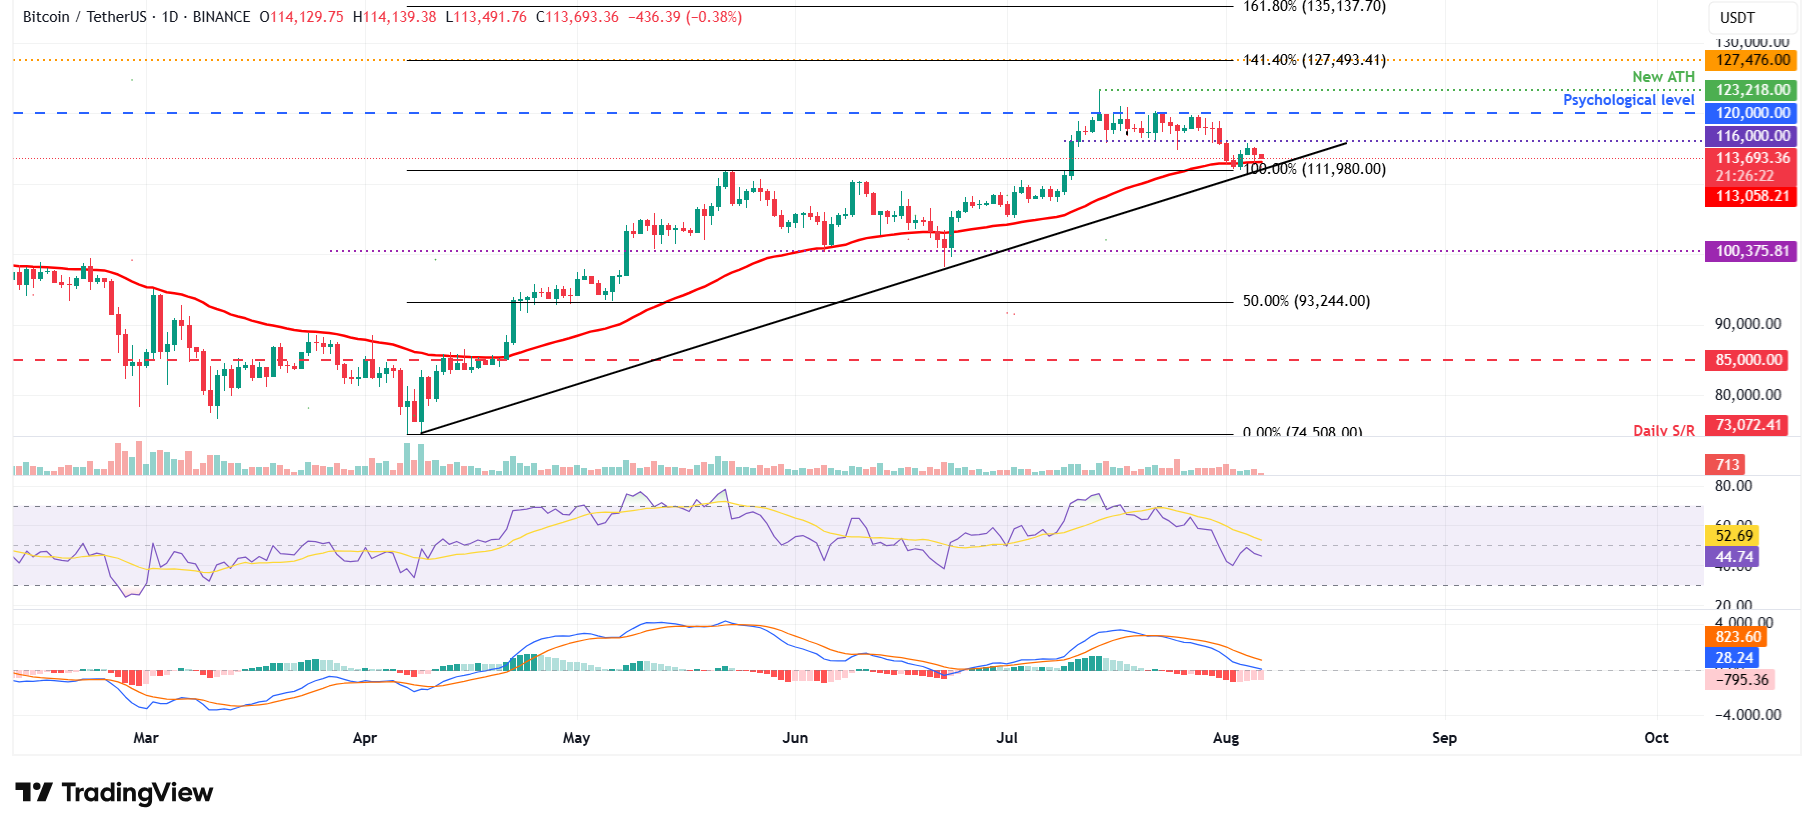
BTC/USDT daily chart
However, if BTC finds support around its 50-day EMA at $113,058, it could extend the recovery toward its key resistance at $116,000.
Ethereum correction continues as it retests its daily resistance at $3,730
Ethereum price found support around its 78.6% Fibonacci retracement level at $3,392 on Sunday and recovered by 10.25% until the next day. However, on Tuesday, it faced rejection from its daily resistance level at $3,730 and declined nearly 3%. At the time of writing on Wednesday, it continues to trade in red at around $3,588.
If ETH continues its correction, it could extend the decline toward its 78.6% Fibonacci retracement level at $3,392.
The RSI on the daily chart reads 56 after bouncing off the neutral level of 50 on Saturday, indicating bullish momentum gaining traction. However, the MACD continues to hold a bearish crossover and supports the correction thesis.
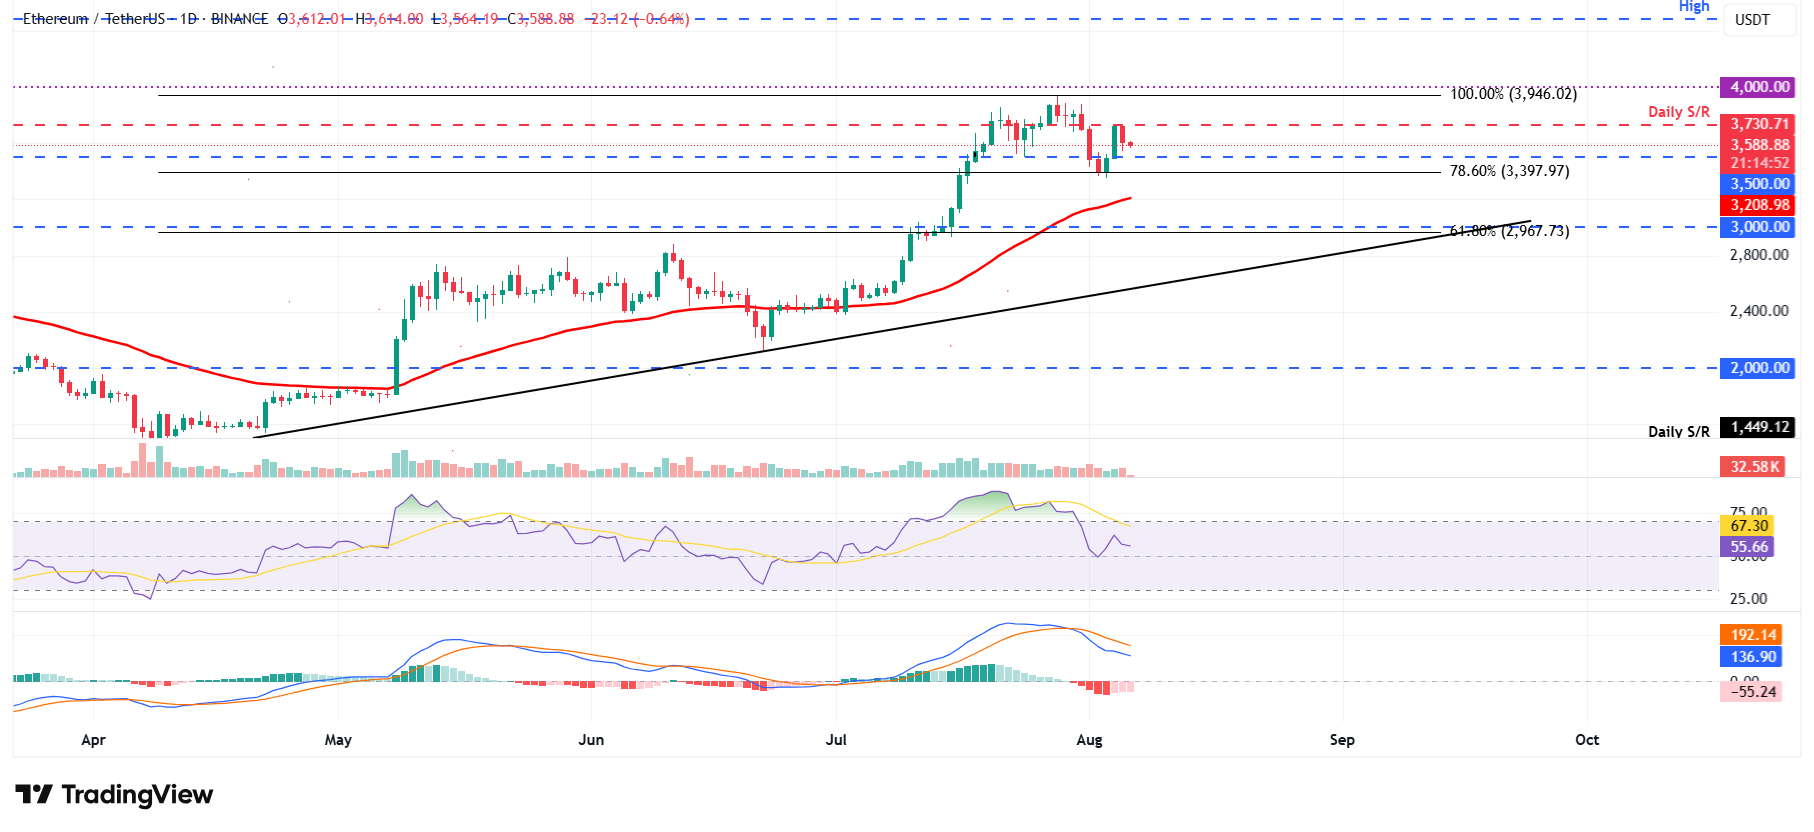
ETH/USDT daily chart
On the other hand, if ETH recovers and closes above the daily resistance at $3,730 on a daily basis, it could extend the recovery toward its next key resistance at $4,000.
XRP shows weakness in momentum indicators
XRP found support around the 50-day EMA at $2.80 on Sunday and recovered nearly 11% by Monday. This 50-day EMA roughly coincides with the daily level at $2.72 and the 50% Fibonacci level at $2.78, making it a key support zone. However, on Tuesday, XRP declined 3.56% and at the time of writing on Wednesday, it continues to trade below $2.92.
If XRP continues a pullback, it could extend the decline toward its key support at $2.80.
The RSI on the daily chart is slipping below its neutral level of 50, indicating fading bullish momentum. Like Ethereum, XRP's MACD indicator also supports the bearish thesis.
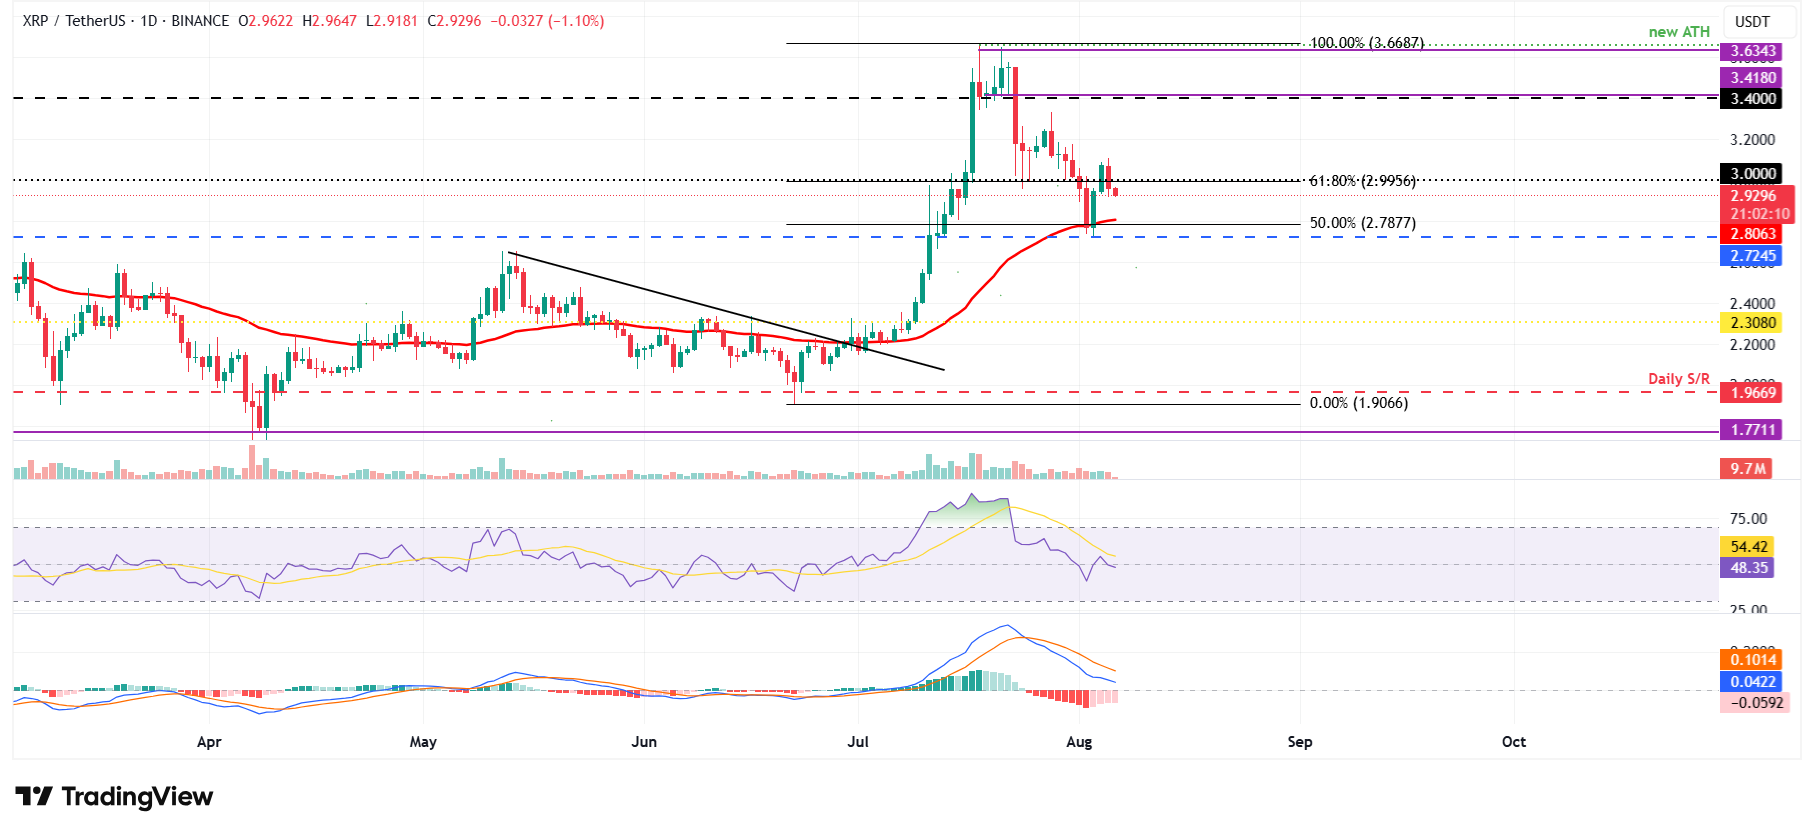
XRP/USDT daily chart
Conversely, if XRP recovers, it could extend the recovery toward its next daily resistance at $3.40.
Read more
* The content presented above, whether from a third party or not, is considered as general advice only. This article should not be construed as containing investment advice, investment recommendations, an offer of or solicitation for any transactions in financial instruments.


