

Top 3 Price Prediction: Bitcoin, Ethereum, Ripple – BTC, ETH, and XRP stabilize near critical support levels

- US-Iran Agreement Brought Forward: Pakistani Prime Minister Confirms US-Iran Agreement Has Taken Effect Immediately, Strait of Hormuz Will Reopen Immediately
- Bitcoin network activity hits new high despite stalled prices — CryptoQuant
- WTI Price Forecast: Trades above $75.50 on Iran uncertainty; 200-day SMA holds the key
- Gold Price Forecast: Hawkish Fed Triggers Gold Plunge, Can US-Iran Agreement Push Gold Past $4,360?
- Qatar and Pakistan: High-level committee agrees on roadmap to final deal within 60 days
- New Fed Chair to Cut Forward Guidance? Warsh Rejects Dot-Plot Expectations, Bullish or Bearish for Bitcoin?

Bitcoin price stabilizes around $105,000 on Monday after closing below its key support level the previous week.
Ethereum hovers around its lower consolidation boundary of $2,461; a close below would indicate a correction ahead.
Ripple's XRP closes below its 50-day EMA support at $2.24, increasing the chances of a deeper correction.
Bitcoin (BTC), Ethereum (ETH), and Ripple (XRP) are showing signs of stabilization around key support levels after a recent correction last week. BTC attempts to regain strength after closing below its critical support level, while ETH and XRP hover near technical thresholds that could determine the direction of their next moves.
Bitcoin could decline if it closes below its 50-day EMA
Bitcoin price closed below its daily support level of $106,406 on Thursday and rebounded after retesting its 50-day Exponential Moving Average (EMA) at $102,893 the following day. BTC stabilized around the $105,000 level during the weekend. At the time of writing on Monday, it continues to consolidate, trading at around $105,788.
If BTC fails to close above the $106,406 resistance level and declines, it could extend the decline to retest its key, psychologically important level at $100,000.
The Relative Strength Index (RSI) on the daily chart is hovering around its neutral level of 50, indicating indecisiveness among traders. The Moving Average Convergence Divergence (MACD) indicator on the daily chart displayed a bearish crossover, signaling a sell and indicating a downward trend.
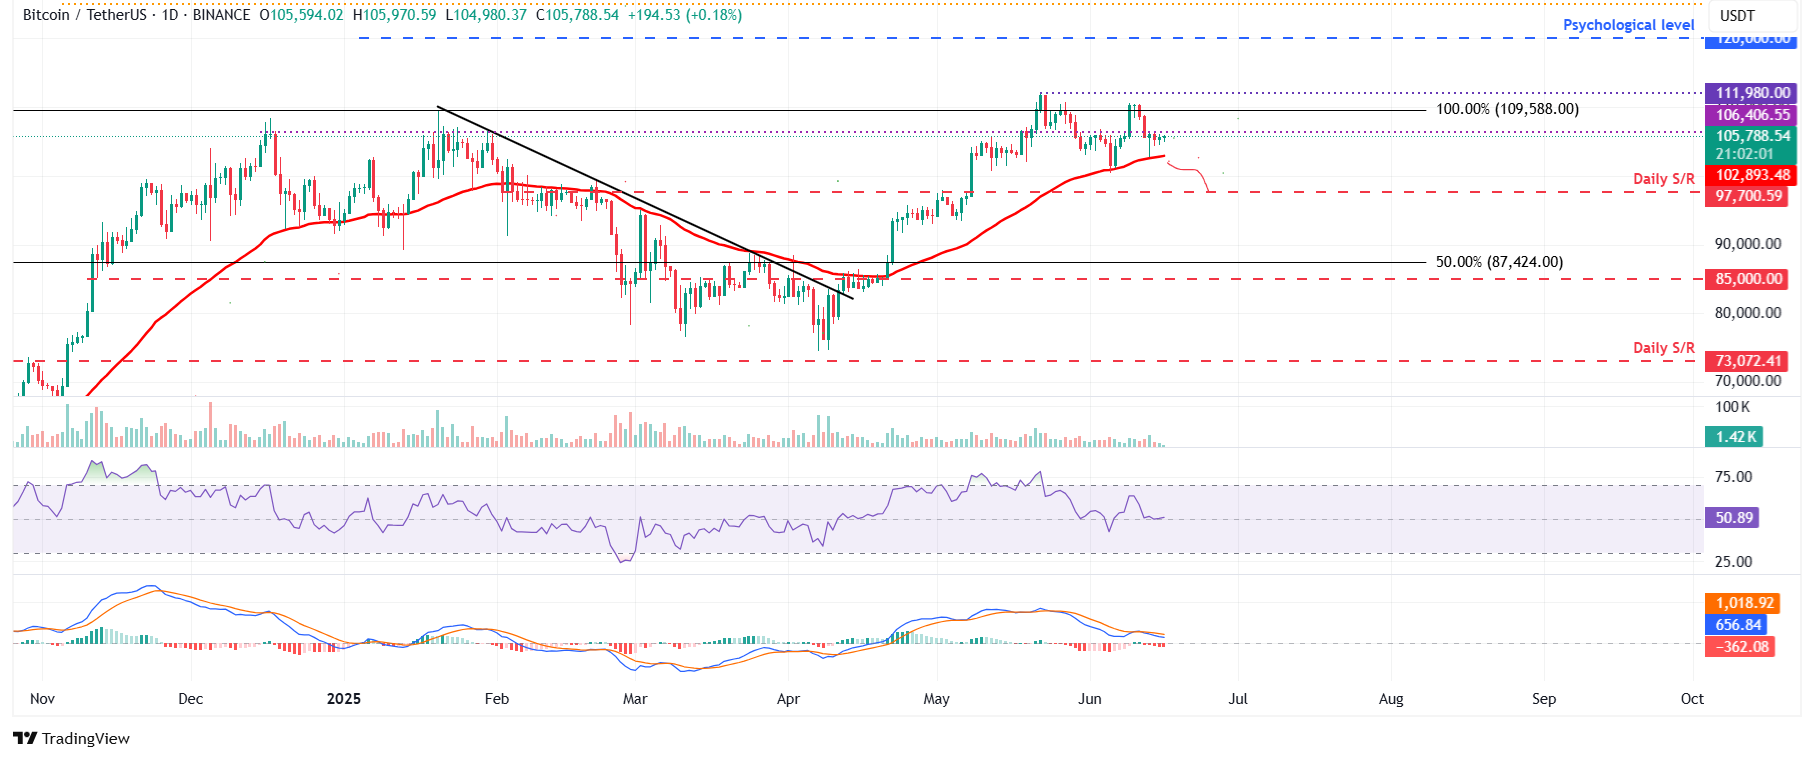
BTC/USDT daily chart
However, if BTC recovers, it could extend the recovery to retest its daily level of $106,406.
Ethereum could face a downleg if it closes below its 50-day EMA
Ethereum price failed to find support around the upper consolidation level of $2,724 on Thursday and declined by 8.69% until Saturday. However, ETH hovered above its lower consolidation boundary of $2,461 the next day. At the time of writing on Monday, it continues to hover above this level.
If ETH faces a correction and closed below its 50-day EMA at $2,429, it could extend the decline to retest its next support level at $2,000.
The RSI on the daily chart is hovering around its neutral level of 50, indicating indecisiveness among traders. The MACD indicator on the daily chart displayed a bearish crossover, signaling a sell and indicating a downward trend.
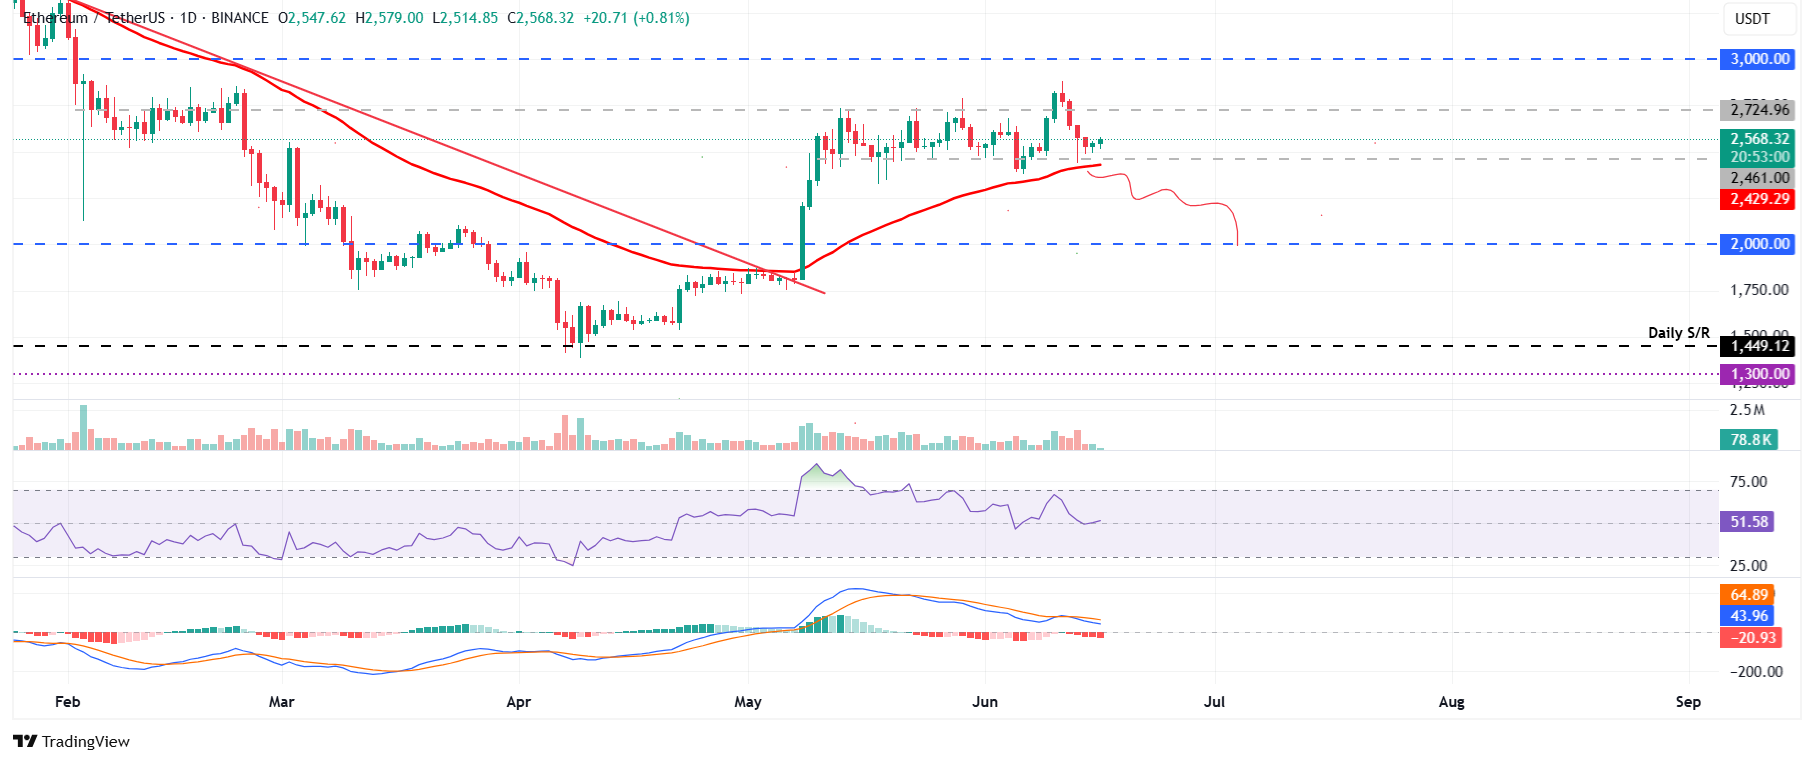
ETH/USDT daily chart
On the other hand, if ETH finds support around its lower consolidation boundary at $2,461, it could extend the recovery to retest its upper consolidation boundary at $2,724.
XRP is poised for a downleg below its 50-day EMA
XRP price closed below its 50-day EMA level at $2.24 on Thursday and declined nearly 6% until Saturday. However, it recovered slightly by 1.22% the next day. At the time of writing on Monday, it is nearing its 50-day EMA at $2.24.
If XRP faces a rejection from its 50-day EMA, it could extend the decline to retest its next daily support level at $1.96.
The RSI on the daily chart reads 45, below its neutral level and points downward, indicating strong bearish momentum. Moreover, the MACD indicator on the daily chart displayed a bearish crossover, signaling a sell and indicating a downward trend.
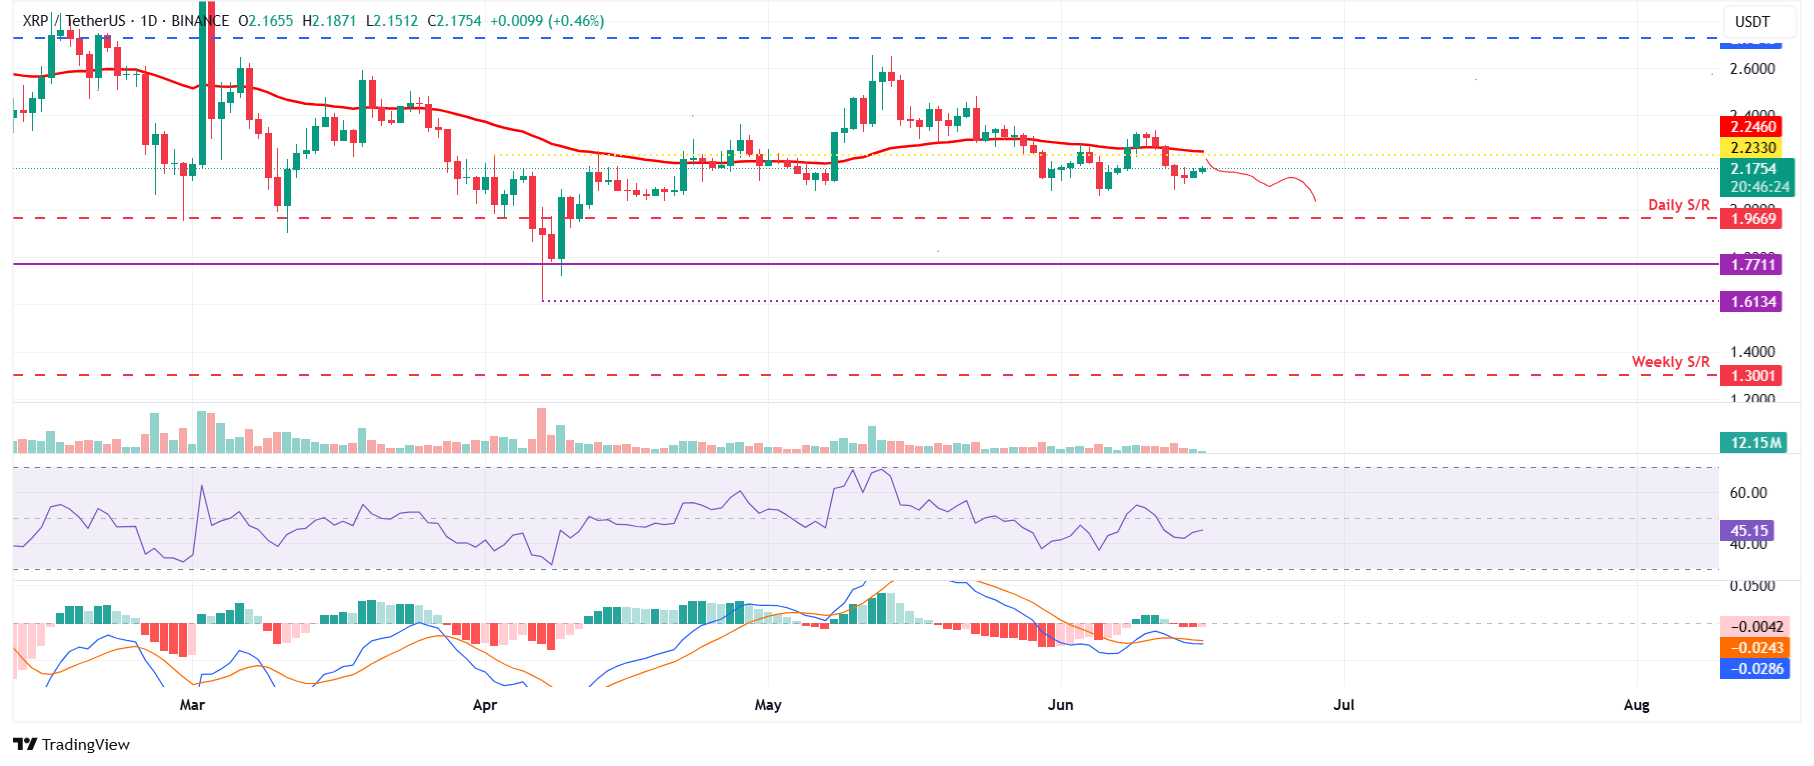
XRP/USDT daily chart
Conversely, if XRP recovers, it could extend to retest its 50-day EMA at $2.25.
Read more
* The content presented above, whether from a third party or not, is considered as general advice only. This article should not be construed as containing investment advice, investment recommendations, an offer of or solicitation for any transactions in financial instruments.


