
Top 3 Price Prediction: Bitcoin, Ethereum, Ripple – BTC, ETH and XRP show early signs of exhaustion


Bitcoin price hovers around $108,500 on Wednesday, following a mild correction the previous day.
Ethereum nears key resistance at $2,724, with momentum waning and correction risks rising.
XRP hovers around its 50-day EMA; a decisive daily close below could trigger further downside.
Bitcoin (BTC) stabilized around $108,500 on Wednesday, appearing to lose steam mid-week after a sharp rally in the previous week. Ethereum (ETH) and Ripple (XRP) are following BTC’s lead near key support levels that could dictate their next moves.
Bitcoin shows signs of potential exhaustion
Bitcoin price reached a new all-time high (ATH) of $111,980 on Thursday and declined by 3.92% on Friday. However, it found support around the $106,406 daily level on Saturday and recovered in the last three days. BTC faced a mild correction on Tuesday. At the time of writing, it trades at around $108,700.
Bitcoin momentum indicators are flashing early warning signs of potential exhaustion. The Relative Strength Index (RSI) on the daily chart reads 64, pointing downward after being rejected from its overbought level of 70, indicating fading bullish momentum. Additionally, the Moving Average Convergence Divergence (MACD) indicator also showed a bearish crossover on Sunday, giving sell signals and suggesting a downward trend.
If BTC faces a pullback, it could extend the correction to retest its daily support level at $106,406. A successful close below this level could extend the decline to revisit its psychologically important level of $100,000.
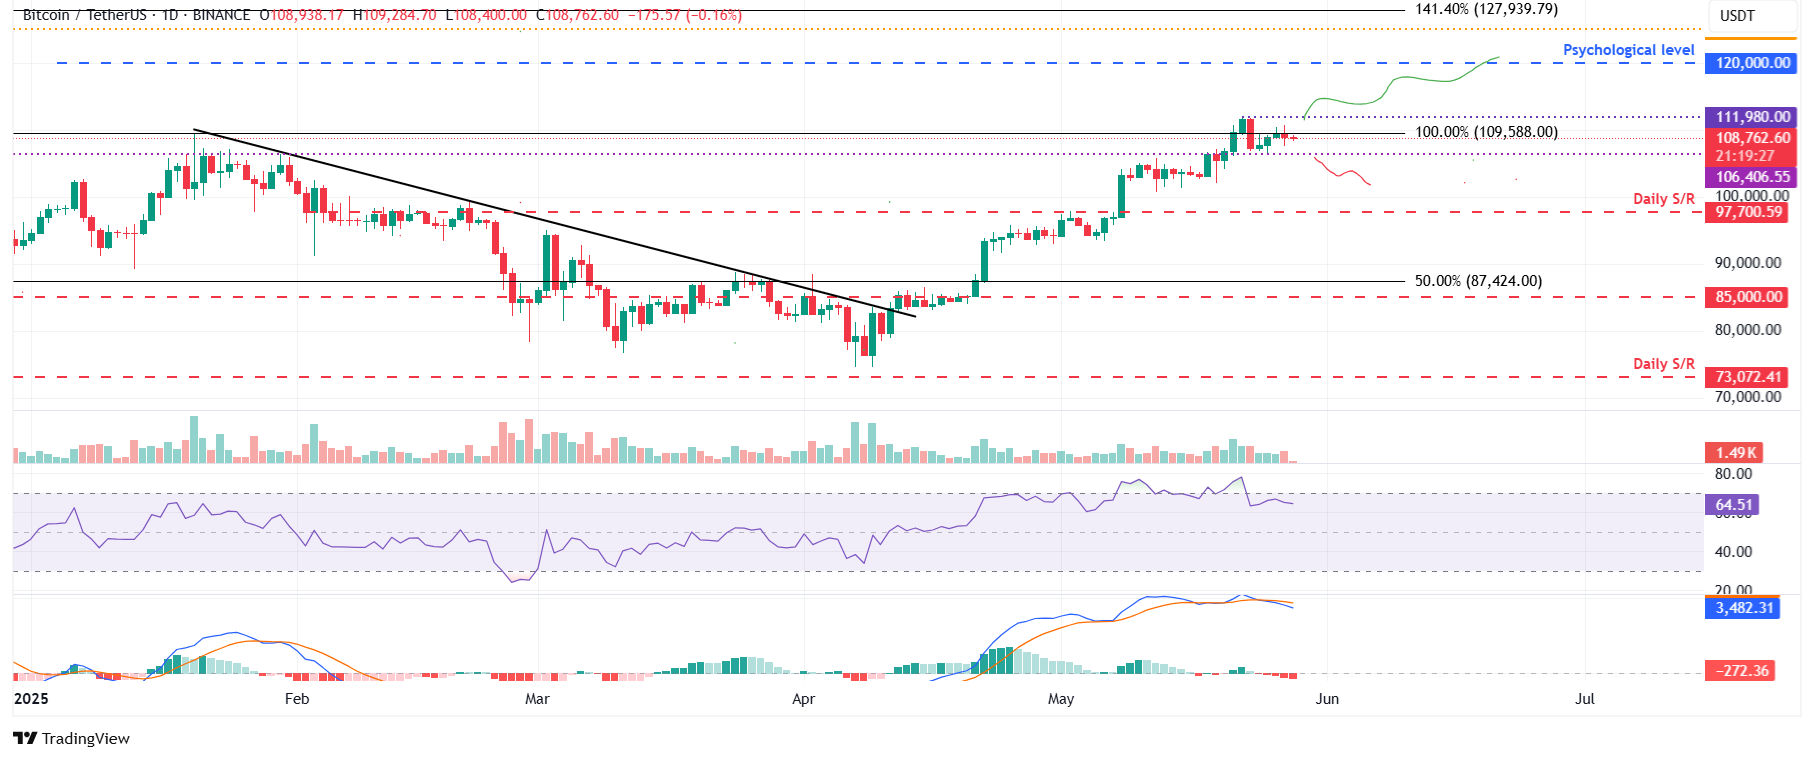
BTC/USDT daily chart
However, if BTC continues to recover and closes above its all-time high, it could extend the rally toward the key psychological level of $120,000.
Ethereum could decline if it faces rejection near the $2,700 resistance
Ethereum price retested and found support around its 200-day Exponential Moving Average (EMA) at $2,451 on Sunday, and it recovered 5% by Tuesday. At the time of writing on Wednesday, it trades at around $2,640, nearing its key resistance level at $2,724.
If ETH faces rejection from its daily level at $2,724 and closes below its 200-day EMA, it could extend the decline to retest its next support level at $2,247, its 50-day EMA.
The RSI on the daily chart reads 66, having been rejected from its overbought level of 70, and is pointing downward, indicating a fading bullish momentum. The MACD indicator also displayed a bearish crossover, further underscoring the weakness in momentum and indicating a potential downward trend.
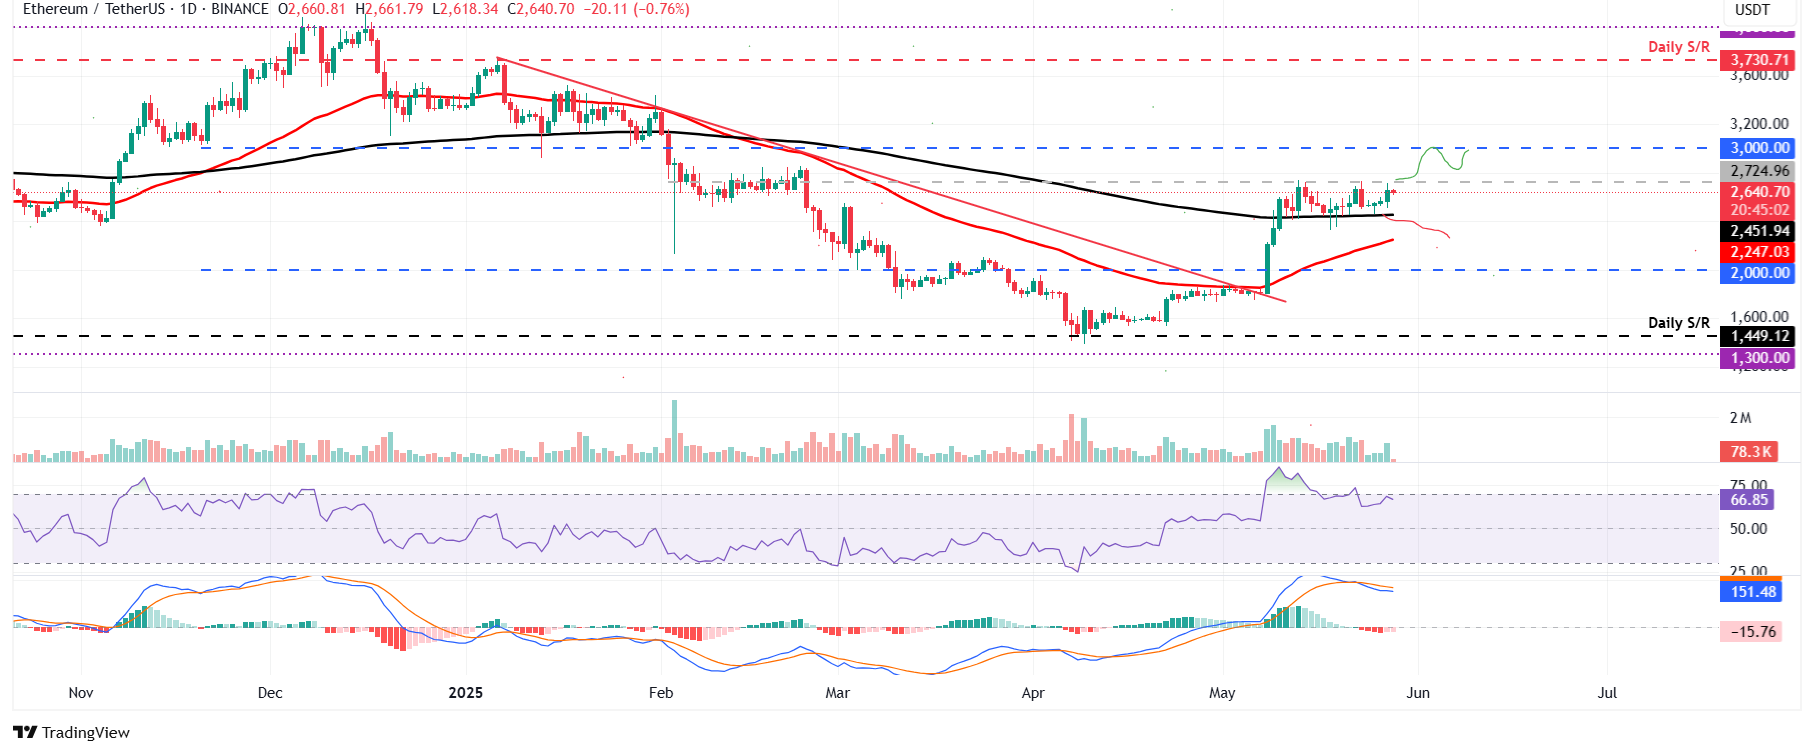
ETH/USDT daily chart
On the other hand, if ETH breaks and closes above its $2,724 resistance on a daily basis, it could extend the rally to retest its psychologically important level at $3,000.
XRP could face a downturn if it closes below its 50-day EMA
XRP price has been consolidating around its 50-day EMA at $2.30 since Saturday. At the time of writing on Wednesday, it continues to hover around this level.
If XRP breaks below the 50-day EMA and closes below the $2.23 support level, it could extend the correction to retest its next support level at $1.96.
The RSI on the daily chart reads 48, which is below its neutral level of 50 and points downward, indicating bearish momentum. The MACD indicator also displayed a bearish crossover, further underscoring the weakness in momentum and indicating a potential downward trend.
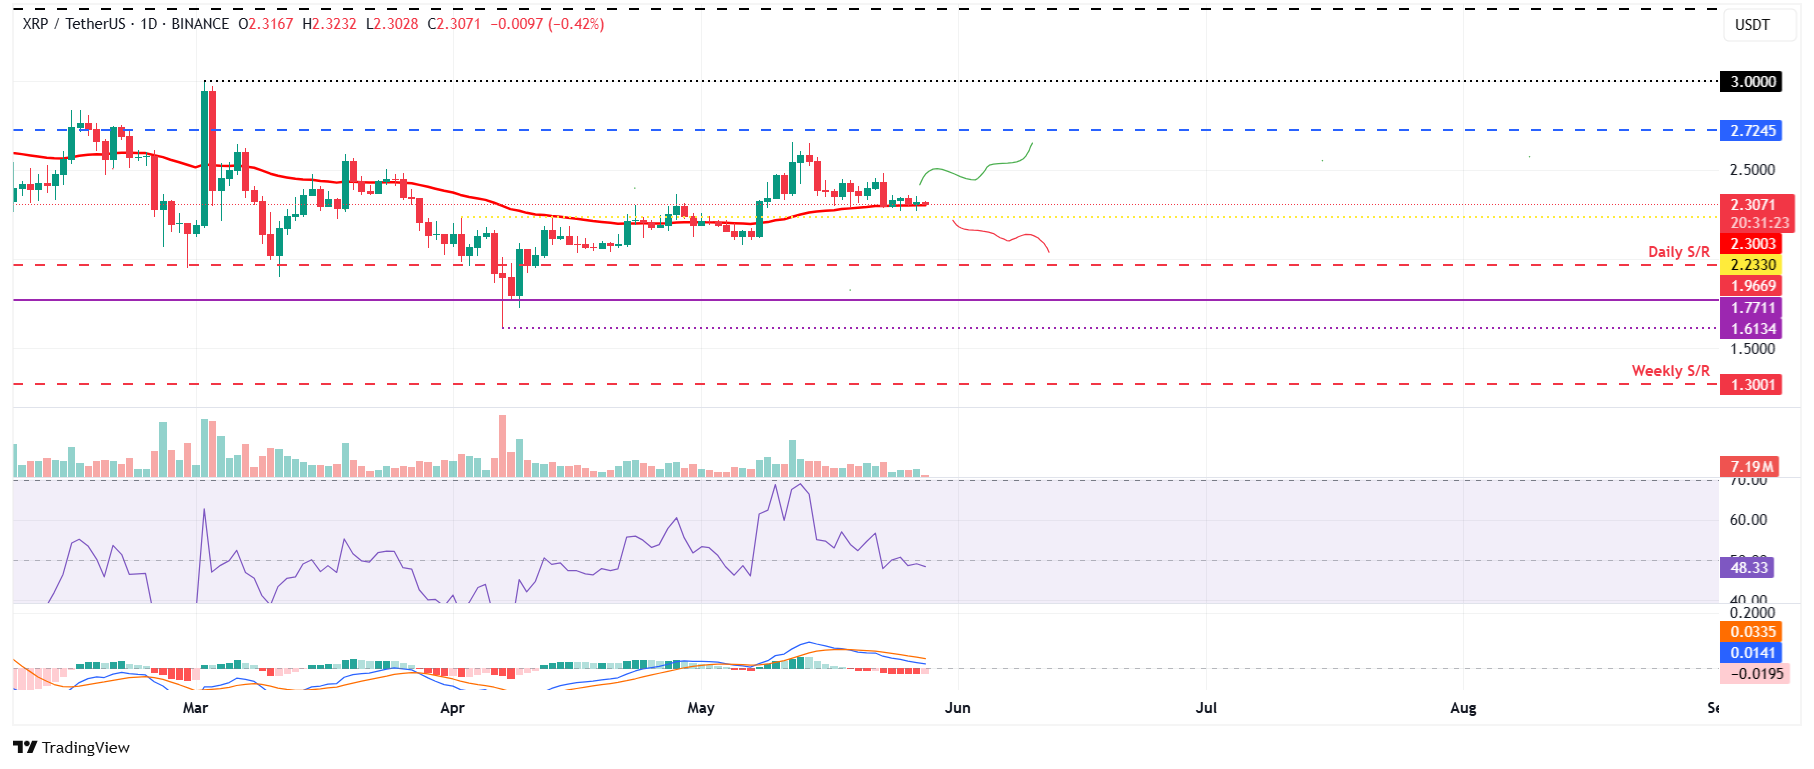
XRP/USDT daily chart
Conversely, if the 50-day EMA continues to hold as support, XRP could extend the recovery to retest its next resistance level at $2.72.
* The content presented above, whether from a third party or not, is considered as general advice only. This article should not be construed as containing investment advice, investment recommendations, an offer of or solicitation for any transactions in financial instruments.


