

Top 3 Price Prediction Bitcoin, Ethereum, Ripple: BTC consolidates while ETH and XRP show some strength

- Bitcoin Drops to $70,000. U.S. Government Refuses to Bail Out Market, End of Bull Market or Golden Pit?
- Gold rallies further beyond $5,050 amid flight to safety, dovish Fed expectations
- Bitcoin Bottom Debate: $70,000 or $50,000?
- A Crash After a Surge: Why Silver Lost 40% in a Week?
- Bitcoin Slips Below 75,000 Mark. Will Strategy Change Its Mind and Sell?
- Bitcoin Rout. Bridgewater Founder Dalio Publicly Backs Gold.

Bitcoin price consolidated between $94,000 and $100,000 for the last nine days.
Ethereum price trades around $2,690 on Friday after rising almost 3% so far this week.
Ripple price hovers around $2.55 after gaining nearly 7% this week.
Bitcoin (BTC) consolidated between $94,000 and $100,000 in the last nine days. Ethereum (ETH) and Ripple (XRP) prices stood relatively stronger and have gained nearly 3% and 7%, respectively, this week.
Bitcoin price consolidates between $94,000 and $100,000 range
Bitcoin price broke below the $100,000 support level on February 4 and has been consolidating between $94,000 and $100,000 ranges. At the time of writing on Friday, BTC hovers around $96,600.
If BTC breaks above the upper consolidating range of $100,000, it would extend the recovery to retest its January 31 high of $106,012.
However, the Relative Strength Index (RSI) on the daily chart reads 44 after being rejected from its neutral level of 50 last week, indicating bearish momentum. Moreover, the Moving Average Convergence Divergence (MACD) showed a bearish crossover, hinting at further correction ahead.
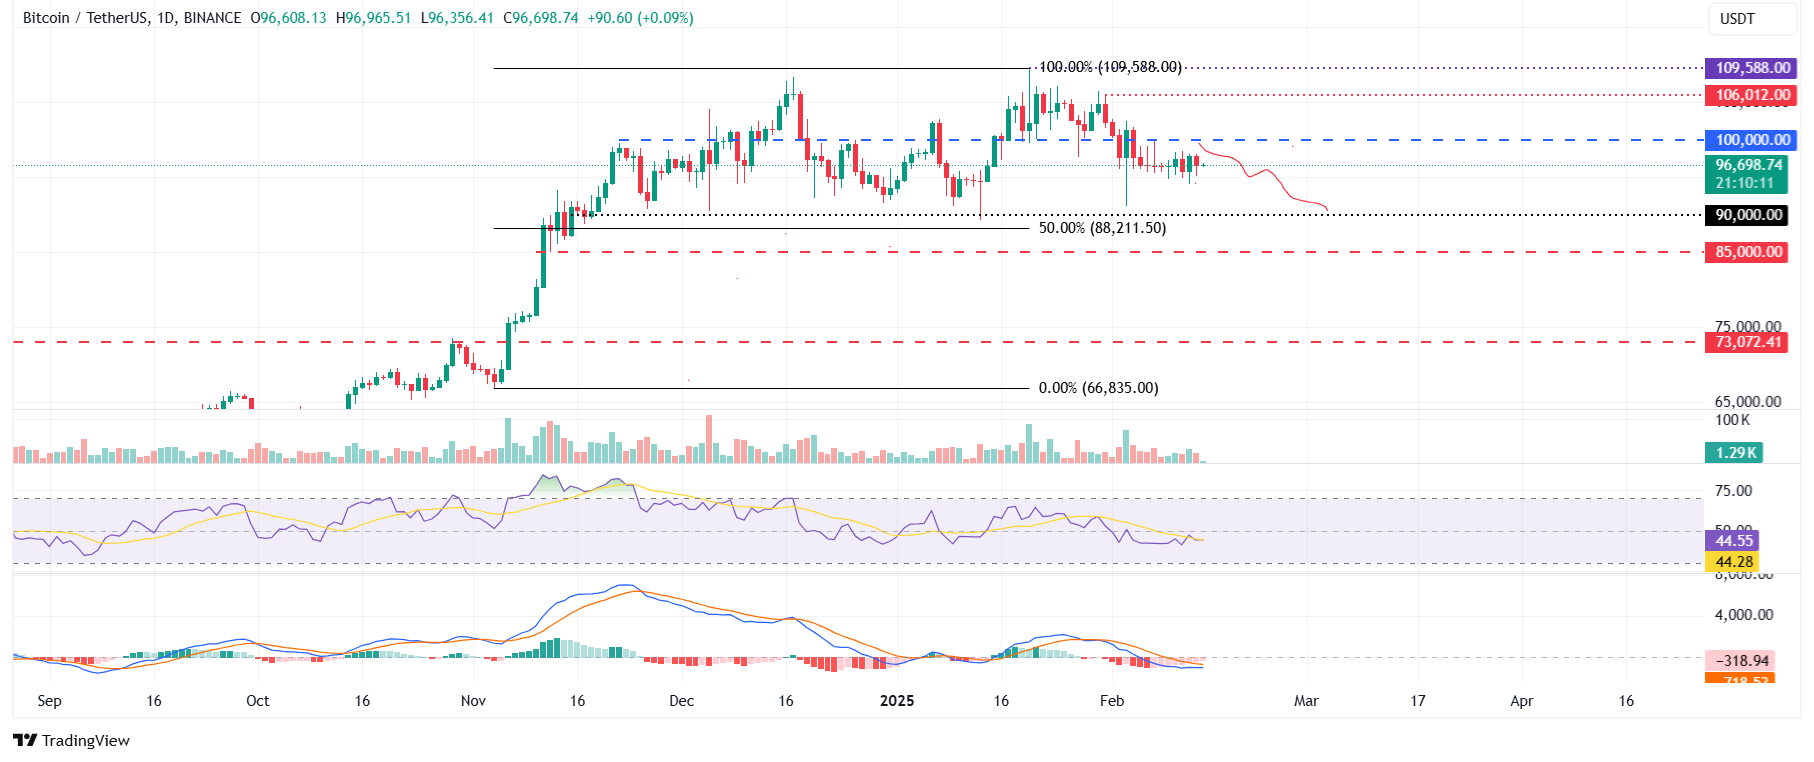
BTC/USDT daily chart
However, if BTC breaks and closes below the lower consolidating range of $94,000, it could extend the decline to test its psychologically important level of $90,000.
Ethereum price shows mild signs of strength
Ethereum price faced a rejection around its descending trendline on February 1 and declined 13.87%, closing below its $3,000 psychologically important level the next day. ETH continued its correction by nearly 9% in the previous week. However, ETH prices strengthened this week and recovered by almost 3%. At the time of writing on Friday, it hovers around $2,690.
If ETH continues to recover, it could extend the recovery to test the $3,000 level.
The RSI on the daily chart reads 38, bounced off from its oversold level of 30, indicating fewer signs of selling pressure. However, the RSI must trade above its neutral level of 50 to sustain the bullish momentum. Such a development would add a tailwind to the recovery rally.
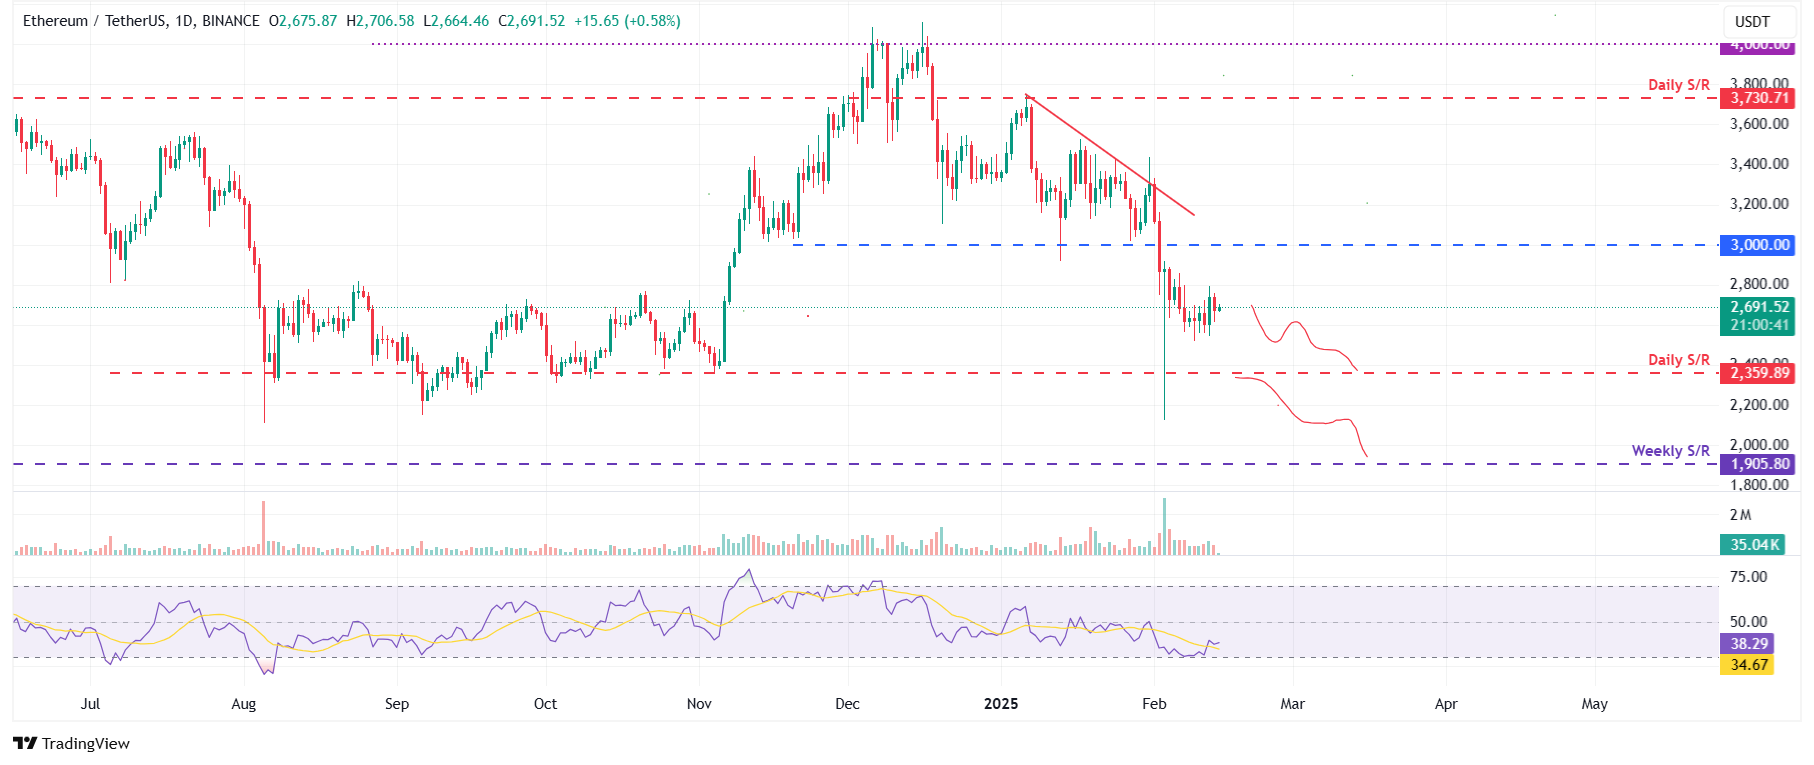
ETH/USDT daily chart
However, If ETH continues its decline and closes below $2,359, it will extend the decline to test its next weekly support at $1,905.
Ripple bulls aiming for $2.72 mark
Ripple price broke below its ascending trendline (drawn by connecting multiple lows since early January) on February 2 and declined by 10.35%, closing below its daily support at $2.72. Last week, XRP faced rejection around the daily level of $2.72 and declined by 11.38% at Sunday’s close. However, XRP prices strengthened this week and recovered by almost 7%. At the time of writing on Friday, it hovers around $2.55.
If XRP continues to recover, it could extend the recovery to test its daily resistance level at $2.72.
The RSI on the daily chart reads 46, bounced off from its oversold level of 30, indicating mild bullish momentum. Like Ethereum, the RSI must trade above its neutral level of 50 for the bullish momentum to be sustained. Such a development would add a tailwind to the recovery rally.
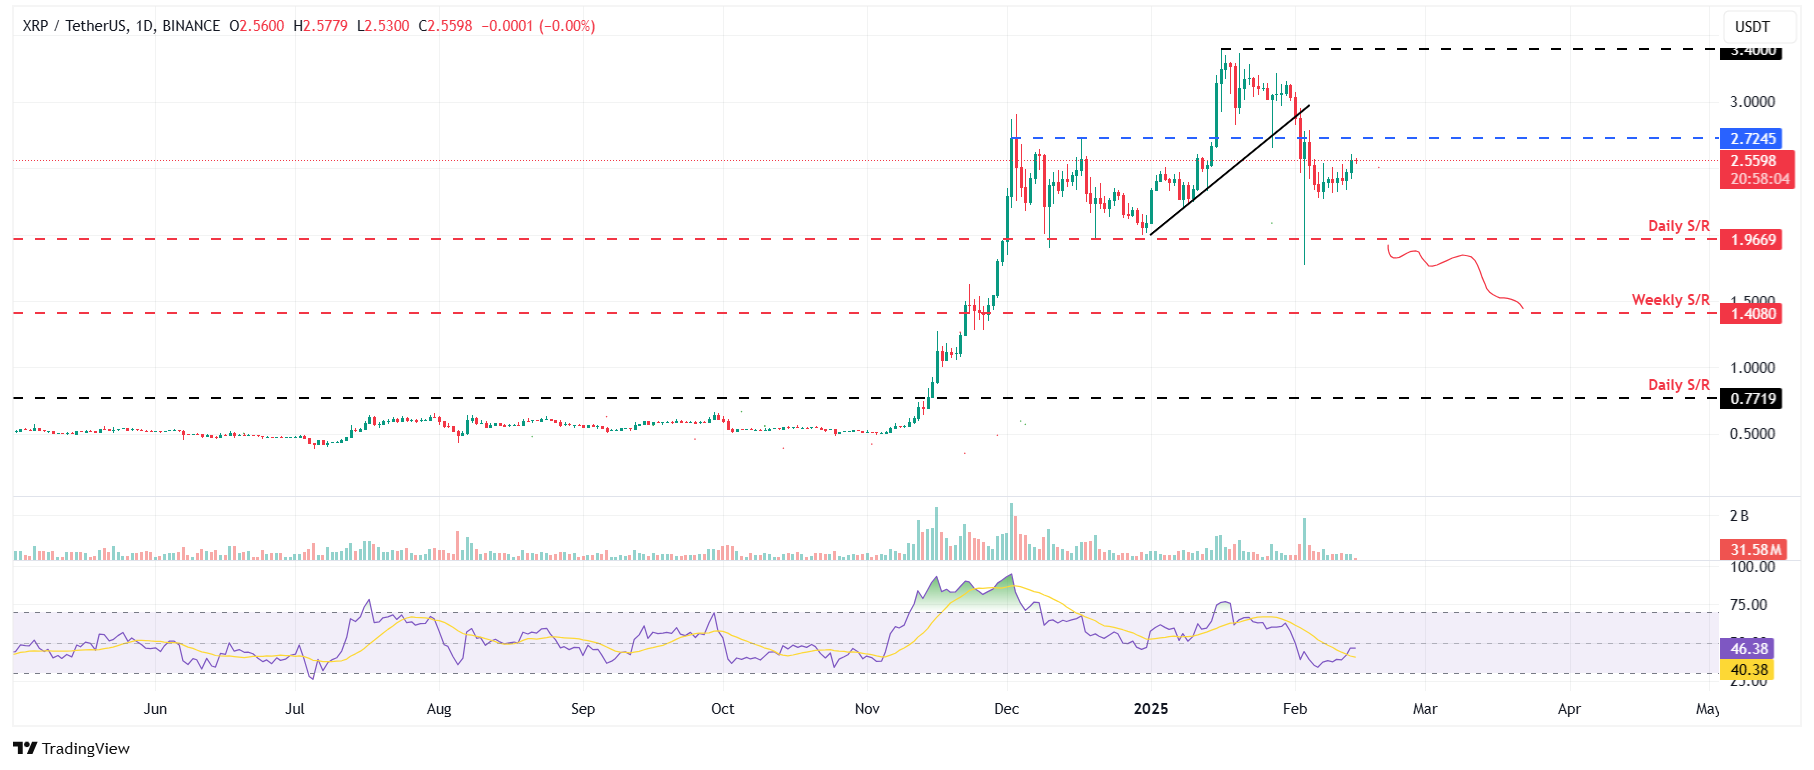
XRP/USDT daily chart
On the other hand, XRP continues its pullback and closes below its daily support at $1.96. It could extend the decline to test its weekly support level at $1.40.
Read more
* The content presented above, whether from a third party or not, is considered as general advice only. This article should not be construed as containing investment advice, investment recommendations, an offer of or solicitation for any transactions in financial instruments.


