Bitcoin price nears all-time high as BTC market cap surpasses $1.3 trillion

Mitrade
Trending Articles
coverImg
Source: DepositPhotos
  • Bitcoin price is trading within the upper range of the November 2021 supply zone as crypto markets rally.


  • BTC could reclaim its $69,000 peak, a level last seen in November 2021, with the potential for an extension to $70K.


  • The pioneer crypto’s market capitalization has already set a new record, breaching the $1.3020 billion threshold.


Bitcoin (BTC) price is soaring, trading within the midline of the November 2021 supply zone. Amid viable prospects for more gains, the pioneer cryptocurrency continues to hit milestones and leads the meme coins sector north along with it.


Bitcoin market capitalization surpasses $1.30 trillion


Bitcoin (BTC) price is trading with a bullish bias, reaching for the $69,000 all-time high as cryptocurrency markets flash green. While BTC is yet to reclaim its peak price, the pioneer crypto’s market capitalization has already hit a new milestone, breaching its November 2021 peak of $1.3020 billion.


The optimism in the Bitcoin market has seen BTC surpass Meta Platforms, the parent company of giant social media platform Facebook, in market capitalization metrics. Reports also indicate that BTC continues to dethrone currencies across the globe.


Specifically, BTC has recorded a new all-time high in 70% (14 out of 20) of the G20 currencies. However, all eyes continue to watch its value against the US dollar (USD).


The host of CNBC’s Mad Money, Jim Cramer, attributes this to traders buying BTC as a hedge against fiat currencies.


Amid frothing trading activity in the market, Coinbase Exchange has crashed again, with users complaining of latency issues and zero balances. However, the platform’s customer support has assured users of the safety of their funds.


Bitcoin price outlook as BTC market cap peaks


Bitcoin price is trading within the upper midrange of the November 2021 supply zone between $60,522 and $67,525. If BTC manages a candlestick close above the midline of this range at $64,023, it would confirm the continuation of the uptrend.


This could set the tone for the continuation of the trend with BTC likely to reclaim the $69,000 peak. In a highly bullish case, the pioneer crypto could extend the gains to $70,000, marking a new all-time high.


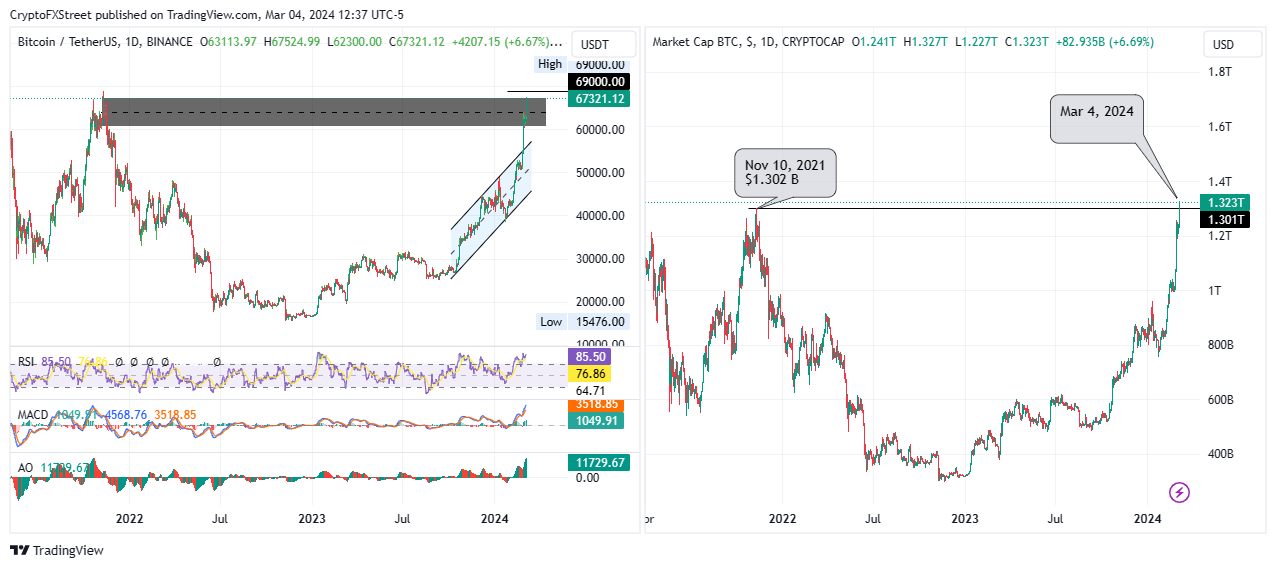
BTC/USDT 1-day chart, BTC market capitalization 1-day chart


Conversely, profit-taking could see Bitcoin price drop, with the supply zone holding as a resistance order block. In such a turnout, BTC could revisit the $60,000 psychological level.


Read more

  • Gold remains bid as lack of Fed clarity and geopolitical frictions persist
  • * The content presented above, whether from a third party or not, is considered as general advice only.  This article should not be construed as containing investment advice, investment recommendations, an offer of or solicitation for any transactions in financial instruments.

    goTop
    quote
    Related Articles
    placeholder
    Senate Delays Crypto Market Structure Hearings to Early 2026The Senate Banking Committee has postponed cryptocurrency market structure hearings until 2026, citing ongoing bipartisan negotiations.
    Author  Mitrade
    15 mins ago
    The Senate Banking Committee has postponed cryptocurrency market structure hearings until 2026, citing ongoing bipartisan negotiations.
    placeholder
    Bitcoin Slides 5% as Sellers Lean In — Can BTC Reclaim $88,000?Bitcoin has dropped back below $88,000 after rolling over from $90,500, with price still trading under the 100-hour Simple Moving Average. The sell-off found a floor at $85,151, and BTC is now consolidating near that base, but rebounds are facing pressure from a bearish trend line around $89,000. Bulls need to retake $88,000–$89,000 to ease downside risk; failure to do so keeps $85,500–$85,000 and then $83,500 in play, with $80,000 as the deeper “line in the sand.” Bitcoin (BTC) is back in damage-control mode after a sharp pullback wiped out recent gains. The price failed to reclaim the $90,000–$90,500 band, rolled over, and slid through $88,500 before briefly dipping under $87,000. Buyers did show up around $85,000, but the rebound so far looks more like stabilization than a clear trend reversal. Bitcoin dips hard, finds a bid near $85,000(h3) BTC’s latest move lower began when it couldn’t build follow-through above $90,000 and $90,500. Once that upside stalled, sellers took control and pushed price down through $88,500. The slide accelerated enough to spike below $87,000, but the market didn’t free-fall. Bulls defended the $85,000 zone, printing a low at $85,151. Since then, Bitcoin has been consolidating below the 23.6% Fibonacci retracement of the drop from the $93,560 swing high to the $85,151 low — a clue that the bounce is still shallow and that sellers haven’t fully backed off yet. Structurally, BTC is still on the back foot: It’s trading below $88,000, and It remains below the 100-hour Simple Moving Average, keeping short-term trend pressure pointed downward. Resistance is layered, and $89,000 is the problem area(h3) If bulls try to turn this into a recovery, they’ll have to climb through multiple ceilings in quick succession. First, BTC faces resistance around $87,150, followed by a more meaningful barrier near $87,500. From there, the market’s attention snaps back to $88,000 — the level BTC just lost and now needs to reclaim. A close back above $88,000 would improve the tone, but it doesn’t solve the bigger issue: there’s a bearish trend line on the hourly BTC/USD chart (Kraken feed) with resistance near $89,000, which also lines up with the next technical hurdle. If BTC can push through $89,000 and hold, the rebound could extend toward $90,000, with follow-through targets at $91,000 and $91,500. But until price clears that $88,000–$89,000 zone, rallies are at risk of being sold rather than chased. If BTC fails to reclaim resistance, the downside path is clear(h3) The near-term bear case is simple: if Bitcoin can’t climb back above the $87,000 area and keep traction, sellers may attempt another leg lower. Support levels line up like this: Immediate support: $85,500 First major support: $85,000 Next support: $83,500 Then $82,500 in the near term Below that, the major “don’t break this” level is still $80,000. If BTC slips under $80,000, the risk of acceleration to the downside increases significantly — not because it’s magic, but because it’s the kind of psychological and structural level that tends to trigger forced de-risking. Indicators: momentum still leans bearish(h3) The intraday indicators aren’t offering much comfort yet: Hourly MACD is losing pace in the bearish zone. Hourly RSI remains below 50, suggesting sellers still have the upper hand on short timeframes. So while the $85,000 defense held for now, the market hasn’t flipped bullish — it’s just stopped bleeding.
    Author  Mitrade
    3 hours ago
    Bitcoin has dropped back below $88,000 after rolling over from $90,500, with price still trading under the 100-hour Simple Moving Average. The sell-off found a floor at $85,151, and BTC is now consolidating near that base, but rebounds are facing pressure from a bearish trend line around $89,000. Bulls need to retake $88,000–$89,000 to ease downside risk; failure to do so keeps $85,500–$85,000 and then $83,500 in play, with $80,000 as the deeper “line in the sand.” Bitcoin (BTC) is back in damage-control mode after a sharp pullback wiped out recent gains. The price failed to reclaim the $90,000–$90,500 band, rolled over, and slid through $88,500 before briefly dipping under $87,000. Buyers did show up around $85,000, but the rebound so far looks more like stabilization than a clear trend reversal. Bitcoin dips hard, finds a bid near $85,000(h3) BTC’s latest move lower began when it couldn’t build follow-through above $90,000 and $90,500. Once that upside stalled, sellers took control and pushed price down through $88,500. The slide accelerated enough to spike below $87,000, but the market didn’t free-fall. Bulls defended the $85,000 zone, printing a low at $85,151. Since then, Bitcoin has been consolidating below the 23.6% Fibonacci retracement of the drop from the $93,560 swing high to the $85,151 low — a clue that the bounce is still shallow and that sellers haven’t fully backed off yet. Structurally, BTC is still on the back foot: It’s trading below $88,000, and It remains below the 100-hour Simple Moving Average, keeping short-term trend pressure pointed downward. Resistance is layered, and $89,000 is the problem area(h3) If bulls try to turn this into a recovery, they’ll have to climb through multiple ceilings in quick succession. First, BTC faces resistance around $87,150, followed by a more meaningful barrier near $87,500. From there, the market’s attention snaps back to $88,000 — the level BTC just lost and now needs to reclaim. A close back above $88,000 would improve the tone, but it doesn’t solve the bigger issue: there’s a bearish trend line on the hourly BTC/USD chart (Kraken feed) with resistance near $89,000, which also lines up with the next technical hurdle. If BTC can push through $89,000 and hold, the rebound could extend toward $90,000, with follow-through targets at $91,000 and $91,500. But until price clears that $88,000–$89,000 zone, rallies are at risk of being sold rather than chased. If BTC fails to reclaim resistance, the downside path is clear(h3) The near-term bear case is simple: if Bitcoin can’t climb back above the $87,000 area and keep traction, sellers may attempt another leg lower. Support levels line up like this: Immediate support: $85,500 First major support: $85,000 Next support: $83,500 Then $82,500 in the near term Below that, the major “don’t break this” level is still $80,000. If BTC slips under $80,000, the risk of acceleration to the downside increases significantly — not because it’s magic, but because it’s the kind of psychological and structural level that tends to trigger forced de-risking. Indicators: momentum still leans bearish(h3) The intraday indicators aren’t offering much comfort yet: Hourly MACD is losing pace in the bearish zone. Hourly RSI remains below 50, suggesting sellers still have the upper hand on short timeframes. So while the $85,000 defense held for now, the market hasn’t flipped bullish — it’s just stopped bleeding.
    placeholder
    Macro Analysts: Hawkish Japan Could Push Bitcoin Below $70KAnalysts predict Bitcoin may face further declines towards the $70,000 mark if the Bank of Japan raises interest rates as expected.
    Author  Mitrade
    Yesterday 05: 48
    Analysts predict Bitcoin may face further declines towards the $70,000 mark if the Bank of Japan raises interest rates as expected.
    placeholder
    Fed Cuts Rates: Bitcoin Rallies Then Retreats - Bear Market Ahead?TradingKey - Fed Rate Cut Fails to Buoy Bitcoin, Signaling Bull Market's End?Early on December 11,the Federal Reserve delivered an expected 25 basis point rate cut.Bitcoin (BTC) briefly surged to $94,
    Author  TradingKey
    Dec 11, Thu
    TradingKey - Fed Rate Cut Fails to Buoy Bitcoin, Signaling Bull Market's End?Early on December 11,the Federal Reserve delivered an expected 25 basis point rate cut.Bitcoin (BTC) briefly surged to $94,
    placeholder
    Bitcoin Breaks Above $94K Again: Is the Bull Market Back?​Bitcoin has reclaimed the $94,000 mark, suggesting a possible short-term bullish uptrend, despite concerns over liquidity.
    Author  Mitrade
    Dec 10, Wed
    ​Bitcoin has reclaimed the $94,000 mark, suggesting a possible short-term bullish uptrend, despite concerns over liquidity.

    Bitcoin Related Articles

    • Trading Chart Patterns:Ultimate Guide to Price Action
    • How to Day Trade Crypto? Simplest Day Trading Strategy Ever
    • Places that Provide Cheapest Ways to Buy Bitcoin In 2025
    • 10 Best Crypto With Most Potential to Buy and invest in 2025 - Top Picks from Expert Traders
    • Top 10 Bitcoin Mining Apps for Android & iOS During 2024
    • How To Buy Bitcoin In Malaysia? Top 7 Best Crypto Exchanges & Trading Apps

    Click to view more