Bitcoin Active Addresses Surge Past 800K – New Wave Of Demand Incoming?

Mitrade
coverImg
Source: DepositPhotos

Bitcoin is currently trading around the $95,000 mark, with bulls struggling to reclaim higher prices after last week’s surge. BTC has been consolidating just below the critical $96K resistance level, and the next few trading sessions are likely to determine whether a decisive breakout or a breakdown will follow.


Market sentiment remains cautiously optimistic, but risks are mounting. If Bitcoin fails to push higher soon and loses the $90,000 support zone, analysts warn that a sharp drop toward lower levels could quickly unfold. Holding above $90K is crucial for sustaining bullish momentum and preventing a deeper correction in the short term.


On-chain data adds an interesting layer to the current market dynamics. According to IntoTheBlock, the number of active Bitcoin addresses spiked sharply yesterday, reaching over 800,000. While still below historical highs, this surge signals a notable increase in activity, which is often an early indicator of renewed market demand and growing participation from traders and investors.


As BTC coils within a narrow range, all eyes are now on whether buyers can step in with enough strength to reclaim the $96K level—or if selling pressure will take control and push prices lower.


Bitcoin Stalls Below $96K As On-Chain Activity Picks Up


Bitcoin is now trading at a critical inflection point, hovering just below the $96,000 resistance after a strong recovery last week. Bulls regained short-term control following a 12% surge, but that momentum appears to be fading without a clear breakout above $96K. To confirm a true euphoric phase and extend the rally, BTC must decisively breach the $100,000 level. Until then, price action remains rangebound and uncertain.


Despite the pause, Bitcoin is showing signs of resilience. Healthy retests of demand zones between $90K and $92K have held, reinforcing bullish sentiment—at least for now. If these levels continue to act as support, a push higher remains on the table.


However, macroeconomic headwinds persist. Geopolitical tensions, particularly the unresolved trade conflict between the US and China, along with concerns over a potential global recession, weigh heavily on risk assets. A negative macro surprise could derail Bitcoin’s upward trajectory quickly.


Still, one encouraging signal comes from the blockchain itself. IntoTheBlock data reveals that Bitcoin’s network activity is rising again, with the number of active addresses surging past 800,000 yesterday.
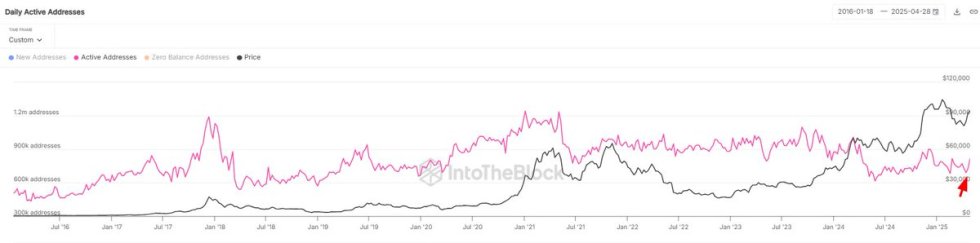

Bitcoin Daily Active Addresses | Source: IntoTheBlock on X


Although still below peak levels, this spike suggests renewed engagement and a possible return of retail interest—a historically bullish sign when paired with strong price action. The next few days will be crucial. Will bulls reclaim momentum and push toward $100K, or will external risks trigger a deeper pullback?


BTC Price Action Consolidates Below Resistance


Bitcoin is currently trading at $94,900 after spending several days consolidating between the $92,000 and $96,000 levels. This tight range has kept traders on edge as bulls attempt to maintain momentum while market participants await a decisive move. The key for bulls now is to break above this consolidation zone and push toward the psychological milestone of $100,000, which would signal a continuation of the broader rally.
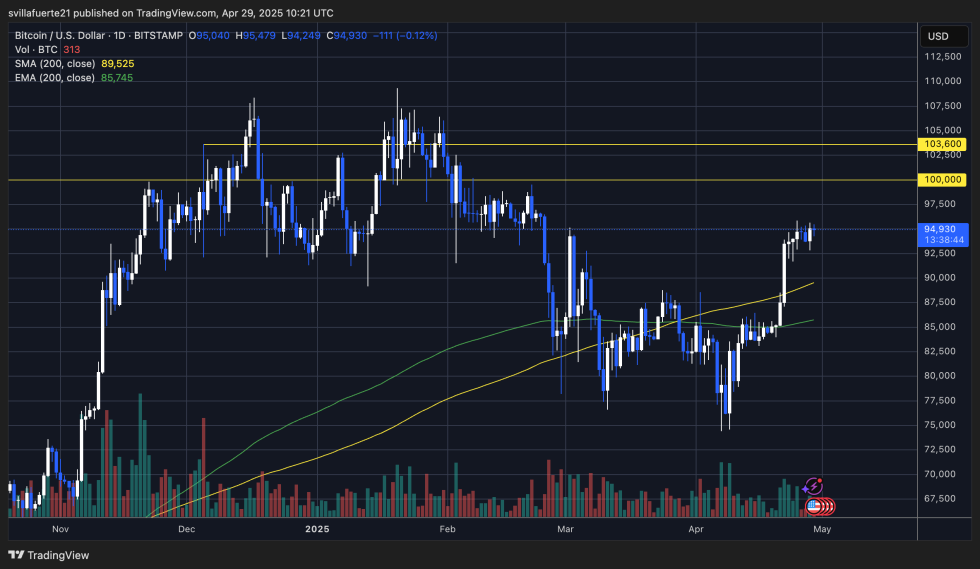

BTC testing resistance below $96K | Source: BTCUSDT chart on TradingView


However, without a strong breakout above $96K, the move risks losing steam and may remain range-bound in the short term. The absence of a catalyst—whether macroeconomic or technical—could lead to continued sideways action and increased volatility within this narrow band.


On the downside, if BTC loses support at $91,000, a drop toward the $87,500 area is likely, where the 200-day moving average and previous demand zones converge. This level would serve as a critical support test and could define whether the current trend maintains a bullish structure or shifts into a corrective phase.


Overall, BTC remains at a crossroads: a breakout above $96K could reignite momentum, while a breakdown below $91K could force a retest of deeper levels and challenge the current bullish narrative.


Featured image from Dall-E, chart from TradingView

Read more

  • Spot Gold Breaches Four Key Levels, Putting $3,500 at Risk as Technicals Enter Oversold Alert Zone
  • TradingKey Daily Market Brief: Three Major US Indexes Drop Over 2%, Anthropic Gains 17% on Debut
  • * The content presented above, whether from a third party or not, is considered as general advice only.  This article should not be construed as containing investment advice, investment recommendations, an offer of or solicitation for any transactions in financial instruments.

    goTop
    quote
    Related Articles
    placeholder
    Nvidia posts record $115.8B Q3 revenue, but crypto stays mutedThe crypto market remained subdued on Tuesday despite Nvidia's (NVDA) Q3 earnings release beating analysts' expectations as demand for artificial intelligence infrastructure continued to drive growth across its business.
    Author  FXStreet
    Nov 18, Wed
    The crypto market remained subdued on Tuesday despite Nvidia's (NVDA) Q3 earnings release beating analysts' expectations as demand for artificial intelligence infrastructure continued to drive growth across its business.
    placeholder
    Ethereum Drops Below $2,000 After Plunging Over 20% in a Month as Odds of $1,500 Retest SurgeEthereum Plunges Over 20% in a Month, Risking a Retest of $1,500 After Losing the $2,000 Defense Line.On November 13, Ethereum (ETH) plunged more than 5%, officially falling below the key
    Author  TradingKey
    Nov 13, Fri
    Ethereum Plunges Over 20% in a Month, Risking a Retest of $1,500 After Losing the $2,000 Defense Line.On November 13, Ethereum (ETH) plunged more than 5%, officially falling below the key
    placeholder
    Bitcoin lost its 200-day average — but the exit started three sessions before the CPIBitcoin fell 2.5% to about $73,400 on 11 November, an 11-week low, breaking its 200-day moving average near $73,100. The 24-hour liquidation tally reached $632 to $705 million, roughly 82% of it longs. But spot ETF outflows began three sessions earlier and USDT's market cap has shrunk $6.6 billion in 60 days — the leveraged length left before the inflation print did. A double top at 81,890 and 81,080 leaves a measured target of 69,366.
    Author  Suzie
    Nov 11, Wed
    Bitcoin fell 2.5% to about $73,400 on 11 November, an 11-week low, breaking its 200-day moving average near $73,100. The 24-hour liquidation tally reached $632 to $705 million, roughly 82% of it longs. But spot ETF outflows began three sessions earlier and USDT's market cap has shrunk $6.6 billion in 60 days — the leveraged length left before the inflation print did. A double top at 81,890 and 81,080 leaves a measured target of 69,366.
    placeholder
    Bitcoin Price Forecast: BTC faces pressure as weekly ETF outflows hit $1.28 billionBitcoin (BTC) remains under pressure on Monday, trading below the 50-week Simple Moving Average (SMA) at $75,222 after extending its losing streak to five consecutive weeks.
    Author  FXStreet
    Nov 09, Mon
    Bitcoin (BTC) remains under pressure on Monday, trading below the 50-week Simple Moving Average (SMA) at $75,222 after extending its losing streak to five consecutive weeks.
    placeholder
    Bitcoin ETFs sold $1.28 billion in a week — and BTC is still above 75,000US spot Bitcoin ETFs logged $1.28 billion of net outflows in the week to Nov 6, the largest since late June, with BlackRock's IBIT accounting for $1.21 billion. Yet BTC only fell from $80,405 to $74,940, a 6.8% move. The gap between the fund flow and the price is the story: leveraged longs were flushed, but spot holders did not follow the ETFs out — and $75,000 is the line that decides whether that reading holds.
    Author  Suzie
    Nov 09, Mon
    US spot Bitcoin ETFs logged $1.28 billion of net outflows in the week to Nov 6, the largest since late June, with BlackRock's IBIT accounting for $1.21 billion. Yet BTC only fell from $80,405 to $74,940, a 6.8% move. The gap between the fund flow and the price is the story: leveraged longs were flushed, but spot holders did not follow the ETFs out — and $75,000 is the line that decides whether that reading holds.
    Live Quotes
    Name / SymbolChart% Change / Price
    BTCUSD
    BTCUSD
    0.00%0.00

    cryptocurrency Related Articles

    • Top 3 Price Prediction: Bitcoin, Ethereum, Ripple — Bulls take the reins, with $100K BTC, $3,500 ETH and $2.35 XRP in focus
    • Best Strategies When BTC Price Drops: From Hedging to Accumulating
    • How to Day Trade Crypto? Simplest Day Trading Strategy Ever
    • Trading Chart Patterns:Ultimate Guide to Price Action
    • Places that Provide Cheapest Ways to Buy Bitcoin In 2025
    • 10 Best Crypto With Most Potential to Buy and invest in 2025 - Top Picks from Expert Traders

    Click to view more