Bitcoin No Longer Electronic Cash? Circulation Drops To Lowest In 13 Years

Mitrade
coverImg
Source: DepositPhotos

On-chain data suggests Bitcoin is no longer being used as electronic cash by its userbase as the token’s circulation has seen a steep drop.


Bitcoin ‘Velocity’ Has Plunged To Historical Lows Recently


As explained by CryptoQuant founder and CEO Ki Young Ju in a post on X, Bitcoin’s circulation has recently slowed down. The on-chain indicator of relevance here is “Velocity,” which keeps track of the rate at which the cryptocurrency’s tokens are circulating in the market.


When the value of this metric is high, the coins move around faster on the network. On the other hand, a low value implies tokens are still inside an address long before being transferred.


Below is a chart that shows how the Velocity of Bitcoin has changed throughout its history.
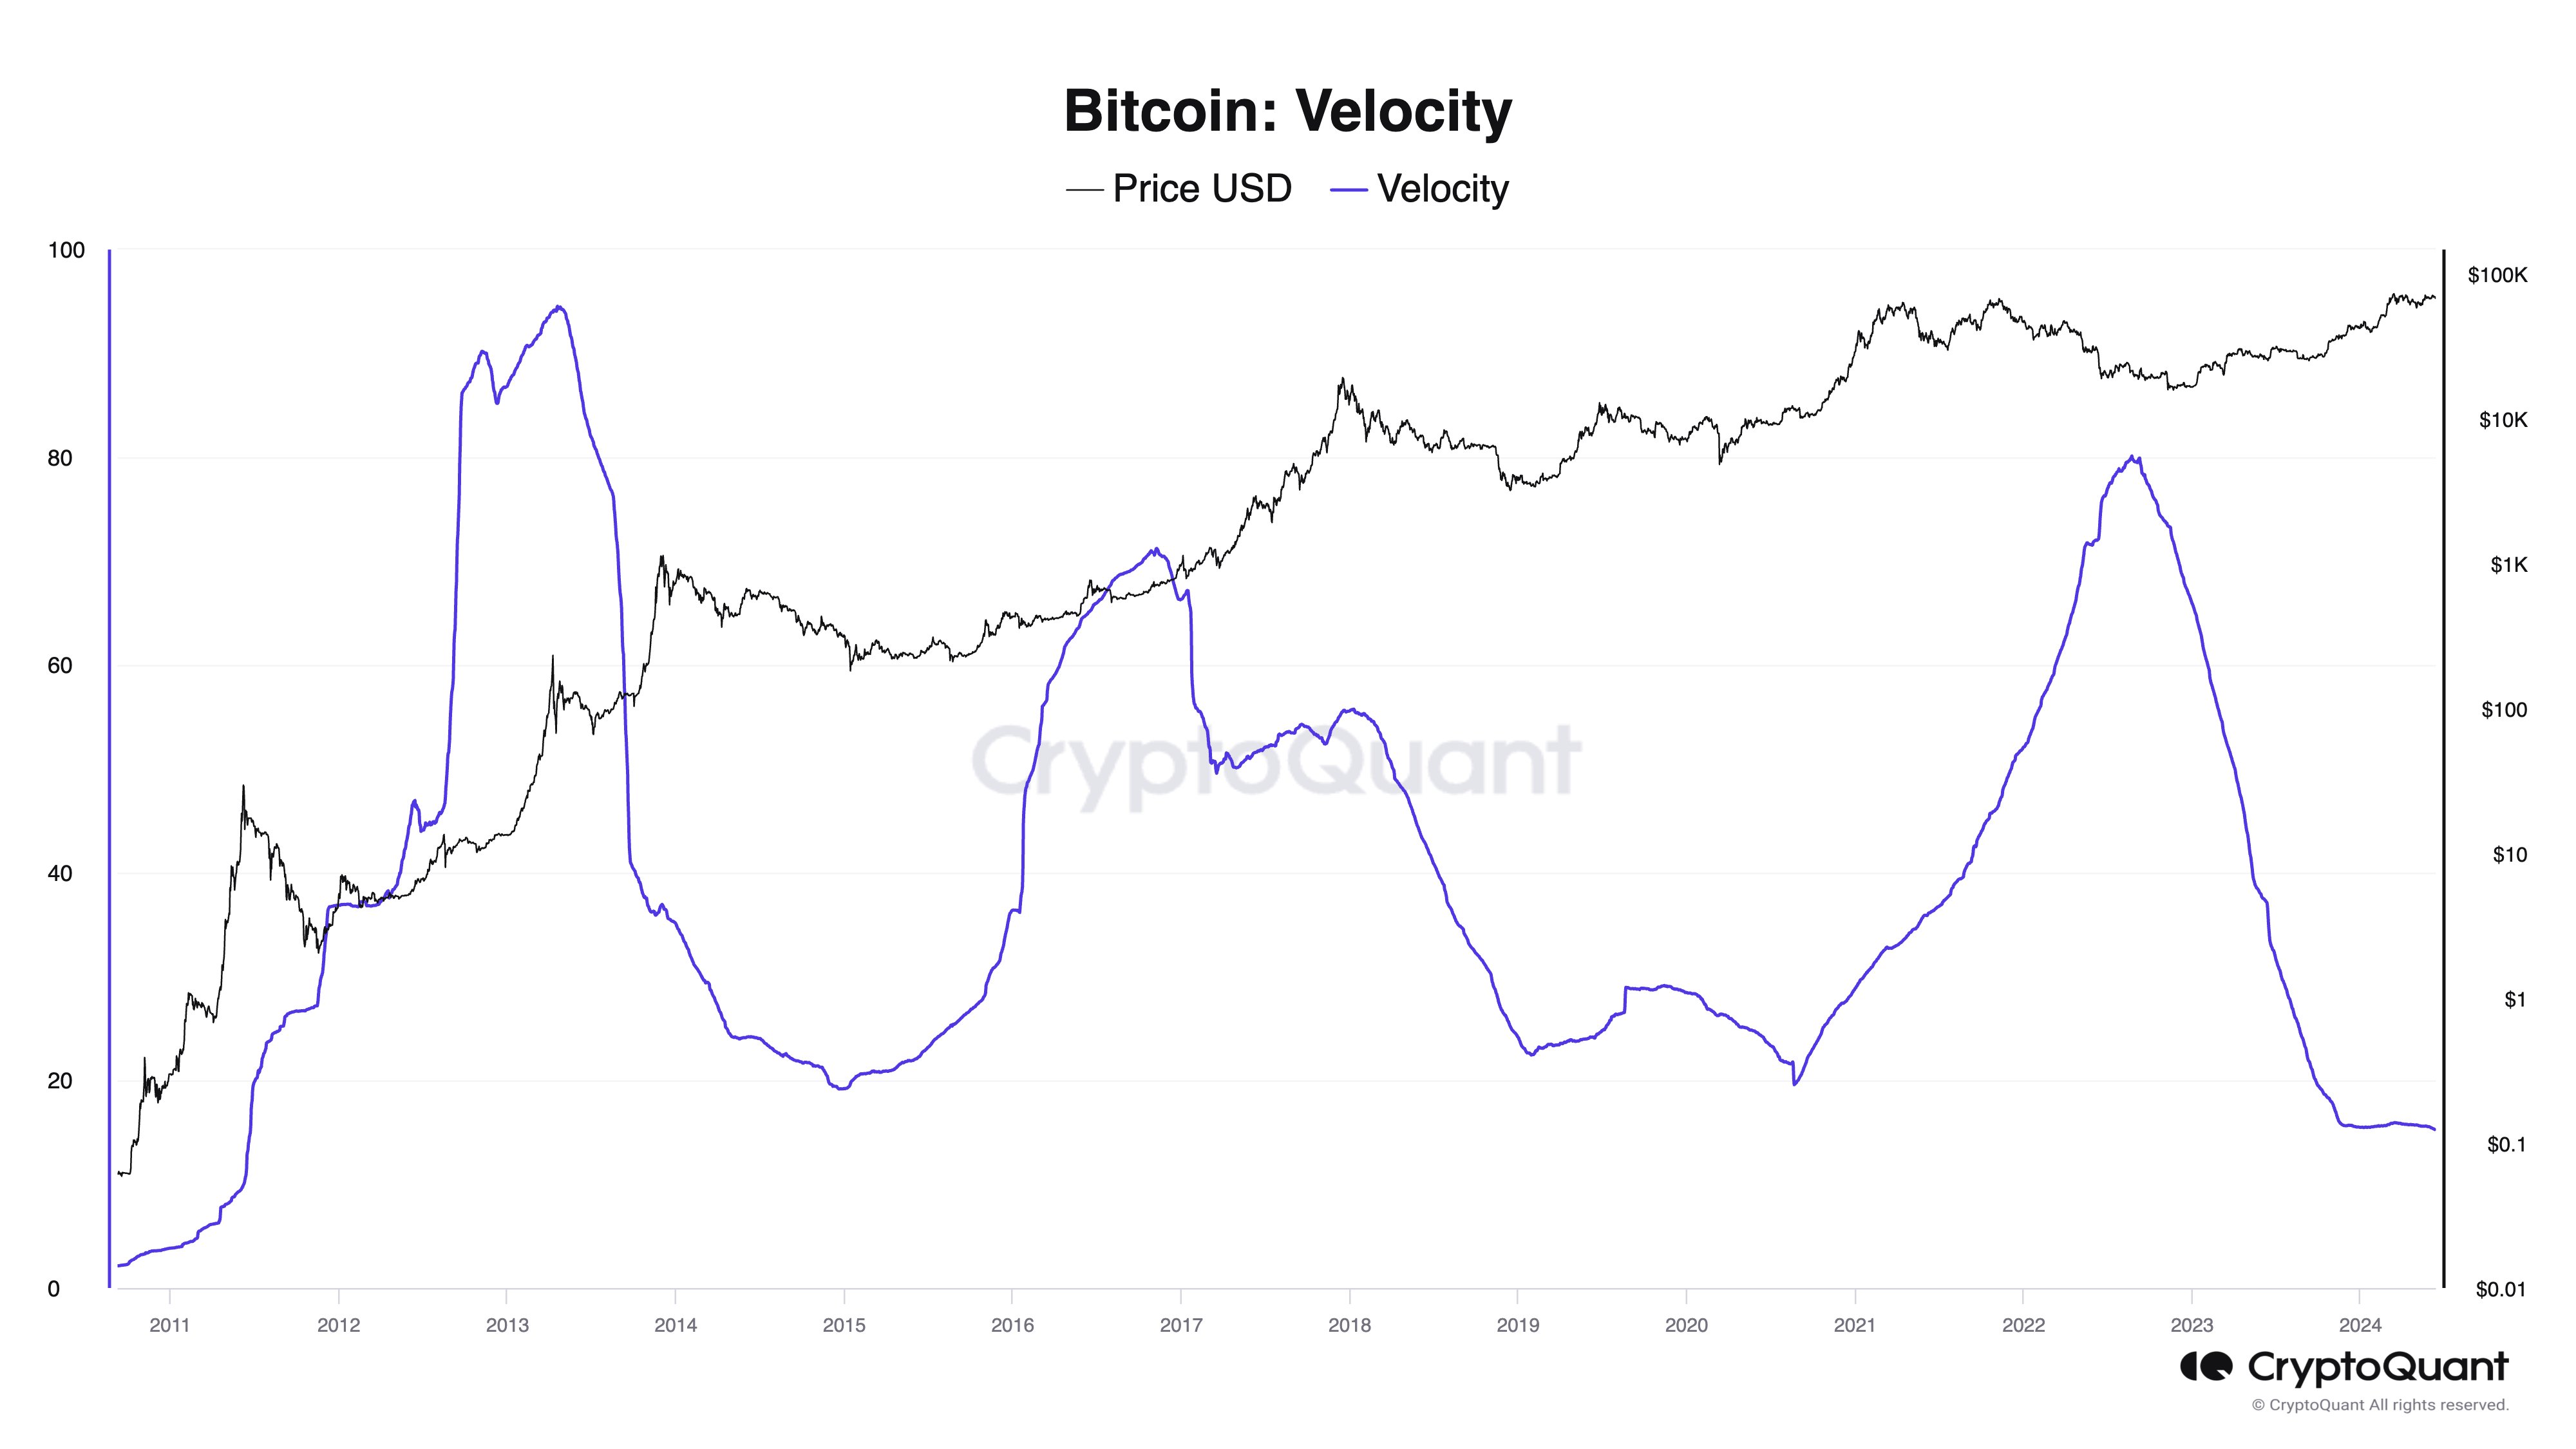
Bitcoin Velocity


As displayed in the above graph, the Bitcoin Velocity had been rising during the 2021 bull run and had observed a peak in the middle of the 2022 bear market. Following this top, though, the metric completely reversed its trend as it started sharply going down instead.


This drawdown continued until the last few months of 2023, and the indicator has been moving sideways since then. The chart shows that these low levels that the metric has recently been consolidating are the lowest in around 13 years.


This would mean the cryptocurrency’s circulation rate is the same as in 2011. Now, as for the significance of the recent trend, it may tell us how the current userbase of the cryptocurrency is looking at the asset.


Bitcoin was originally meant to be cash in electronic form that works peer-to-peer (P2P), without requiring any central entity at all. The fact that the BTC tokens are no longer being circulated would imply that they aren’t being used much for monetary transactions. As the CryptoQuant founder puts it,Despite Satoshi’s vision of “P2P Electronic Cash,” Bitcoin is primarily used as “Digital Gold,” with institutions holding it without frequent transactions.


It’s unclear whether the recent low Velocity is here to stay for BTC, given that the indicator did observe a rapid increase to high values just a few years back.


As the graph shows, the indicator has gone through cycles over the cryptocurrency’s history, shifting between highs and lows. Ju notes Bitcoin will see its velocity “peak someday when BTC is widely used for payments.”


BTC Price


Bitcoin has extended its latest decline as its price is now down to just $66,400. The cryptocurrency’s returns now stand at -8% since the $72,000 high registered on Friday.


Bitcoin Price Chart


Read more

  • Gold Price Forecast: Gold Rebounds Nearly 2% After Falling Below $3,900; Has a Short-Term Bottom Formed?
  • Breaking: US Dollar falls below 101.50 as early midterm results point to Democratic gains
  • * The content presented above, whether from a third party or not, is considered as general advice only.  This article should not be construed as containing investment advice, investment recommendations, an offer of or solicitation for any transactions in financial instruments.

    goTop
    quote
    Related Articles
    placeholder
    Binance replaced 95% of a $6.3bn hole — Bitcoin is trading the plumbing, not the coinBinance resumed withdrawals on November 1 after a record $6.3bn theft. In the first 9.5 hours, users withdrew $4.64bn and deposited $1.01bn, a net outflow of $3.64bn, or 2.1% of assets. Bitcoin fell to 76,173 and is now 78,473. The market is pricing the exchange, not the supply.
    Author  Suzie
    Nov 02, Mon
    Binance resumed withdrawals on November 1 after a record $6.3bn theft. In the first 9.5 hours, users withdrew $4.64bn and deposited $1.01bn, a net outflow of $3.64bn, or 2.1% of assets. Bitcoin fell to 76,173 and is now 78,473. The market is pricing the exchange, not the supply.
    placeholder
    Bitcoin is back above $80,000 — but 75% of the bounce was shorts, not buyersBitcoin trades at $80,669, back above the $80,000 line after touching $79,145 on October 24. But 75.4% of the last 24 hours of futures liquidations were shorts, CME open interest fell 36,545 BTC in October, and spot ETFs lost $773.5 million on October 22-23. Price is up; positioning is down. Here is why the bounce is a squeeze, and the four things that would make it real.
    Author  Suzie
    Oct 28, Wed
    Bitcoin trades at $80,669, back above the $80,000 line after touching $79,145 on October 24. But 75.4% of the last 24 hours of futures liquidations were shorts, CME open interest fell 36,545 BTC in October, and spot ETFs lost $773.5 million on October 22-23. Price is up; positioning is down. Here is why the bounce is a squeeze, and the four things that would make it real.
    placeholder
    Bitcoin's double top at $88,000: why $78,000 is the line that decides the next moveBitcoin trades near $82,500 (+0.47%) after twice failing at the $88,000 area, forming a potential double top with a neckline at $78,000. A break below the neckline would project a measured target near $68,200; a close back above $88,000 would invalidate the pattern. Here are the structure, the levels and what would confirm either side.
    Author  Suzie
    Oct 19, Mon
    Bitcoin trades near $82,500 (+0.47%) after twice failing at the $88,000 area, forming a potential double top with a neckline at $78,000. A break below the neckline would project a measured target near $68,200; a close back above $88,000 would invalidate the pattern. Here are the structure, the levels and what would confirm either side.
    placeholder
    Bitcoin's V-shaped rebound: from $80,953 back above $83,000 — spot buyers step in as the Fed softens, but ETF outflows lingerBitcoin slid to $80,953 on October 13 — then snapped back above $83,000, reclaiming the 81,847–82,305 'golden zone' on spot-led buying as Williams and Waller cooled the Fed's hawkish tone and the dollar pulled back from its 18-month high. But October ETF outflows near $386 million and a fear-and-greed reading of 56 say the repair is unfinished. Here are the levels, the transmission chain and both cases ahead of tonight's US CPI.
    Author  Suzie
    Oct 14, Wed
    Bitcoin slid to $80,953 on October 13 — then snapped back above $83,000, reclaiming the 81,847–82,305 'golden zone' on spot-led buying as Williams and Waller cooled the Fed's hawkish tone and the dollar pulled back from its 18-month high. But October ETF outflows near $386 million and a fear-and-greed reading of 56 say the repair is unfinished. Here are the levels, the transmission chain and both cases ahead of tonight's US CPI.
    placeholder
    Bitcoin Stages V-Shaped Reversal, Surges to Reclaim $83,000 LevelImpacted by a slump in South Korean stocks, Bitcoin prices dropped, but subsequently staged a strong rebound to recoup most of their losses.On October 13, Bitcoin (BTC) experienced a shar
    Author  TradingKey
    Oct 13, Tue
    Impacted by a slump in South Korean stocks, Bitcoin prices dropped, but subsequently staged a strong rebound to recoup most of their losses.On October 13, Bitcoin (BTC) experienced a shar
    Live Quotes
    Name / SymbolChart% Change / Price
    BTCUSD
    BTCUSD
    0.00%0.00

    Bitcoin Related Articles

    • Bitcoin Leverage And Margin Trading in 2026: The Ultimate Beginner's Guide
    • Gold vs Bitcoin 2026: Which Is the Better Investment?Best Hedge Asset Comparison
    • Best Strategies When BTC Price Drops: From Hedging to Accumulating
    • How to Day Trade Crypto? Simplest Day Trading Strategy Ever
    • Bitcoin Price Prediction 2026-2030: Long-Term Outlook Driven by Data & Macro Cycles
    • Bitcoin Mining Beginner Guide: What Is Bitcoin Mining and How to Mine Bitcoin?

    Click to view more