

Bitcoin ‘CDD’ Hits All-Time High: What’s Driving This Trend?

- Gold Price Forecast: Gold Poised to Break $4,200 as Oil Price Slump Eases Inflation Fears
- Gold declines despite easing concerns over inflation, interest rate hikes
- Fed Decision Eve: 104 Economists Expect No Change; Why Is Citadel Securities Betting on a Surprise Hike?
- Gold Price Forecast: Can Gold Hold $4,020 as Fed Rate Hike Expectations Rise?
- Middle East War updates: US-Iran pause strikes as Trump weighs up diplomatic options
- WTI Oil flirts with the $80 level amid speculation about US-Iran peace talks

On-chain data shows the Bitcoin Coin Days Destroyed (CDD) has reached a new all-time high (ATH). Here’s what could be behind this trend.
Bitcoin CDD Has Just Observed A Spike Larger Than November 2018
As pointed out by CryptoQuant community manager Maartunn in a post on X, the BTC CDD has just witnessed a huge spike. The CDD is an on-chain indicator that’s based on the concept of “coin days.”
A coin day is a quantity that 1 BTC accumulates after staying dormant on the blockchain for 1 day. Thus, when a coin remains on the same wallet for some number of days, it gains an equal number of coin days.
When such a dormant coin is finally moved on the network, its coin days counter naturally resets back to zero, and the coin days it had been carrying before are said to be “destroyed.” The CDD keeps track of the number of such coin days being destroyed across the network on any given day.
Now, here is a chart that shows the trend in the Bitcoin CDD over the history of the cryptocurrency:
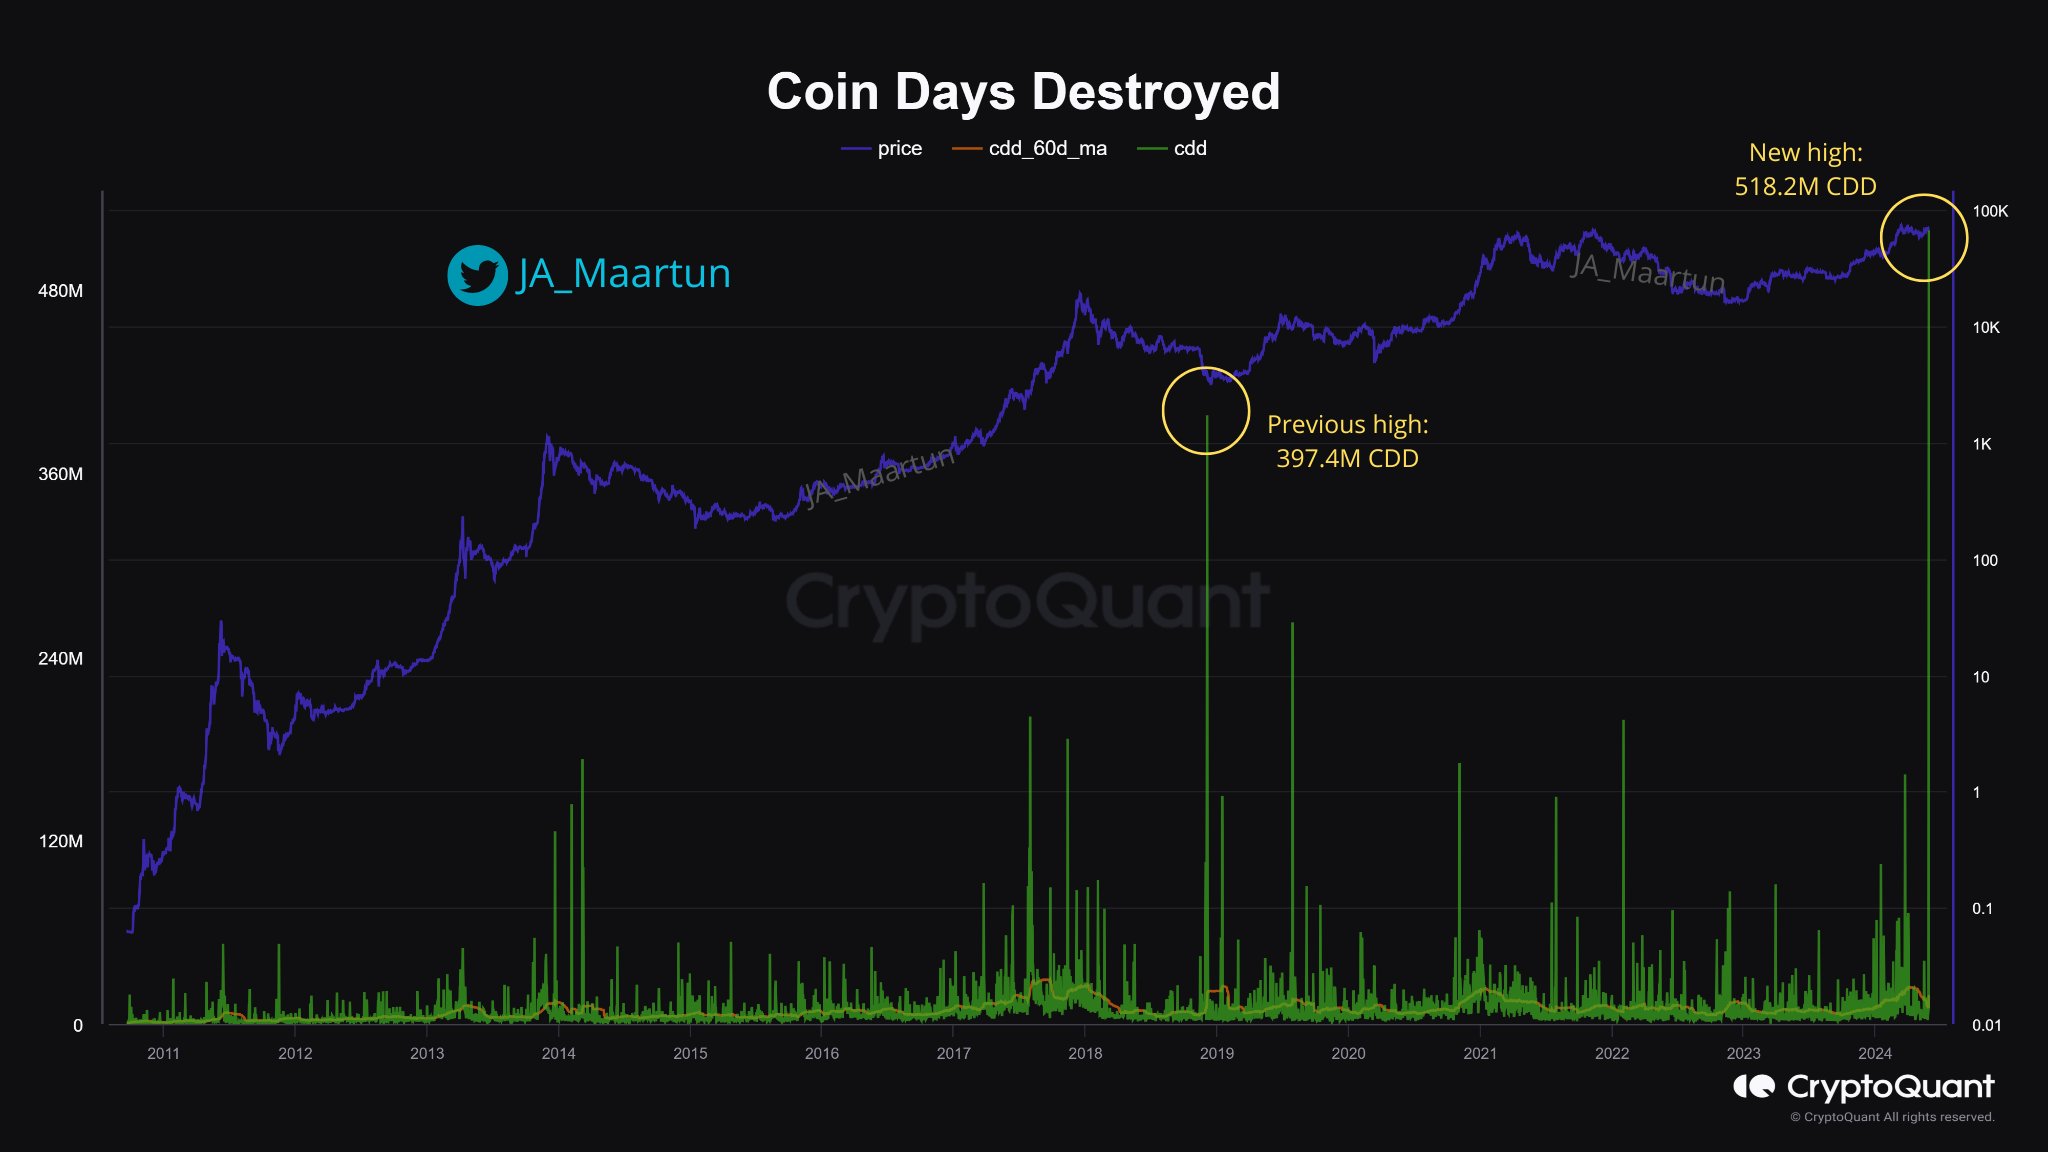
As the above graph shows, the Bitcoin CDD has just registered a huge spike, suggesting that transactions on the network have reset many coin days.
Generally, such spikes in the indicator are associated with movements from long-term holders (LTHs). Investors belonging to this cohort tend to HODL tokens for long periods, so they naturally accumulate a large number of coin days.
When these resolute hands finally make transactions, these accumulated coin days get flushed, causing the metric to attain a high value. Usually, the LTHs break their silence when they want to sell, so spikes in the indicator can be a potential sign that these diamond hands are participating in a selloff.
During the latest spike in the CDD, 518.2 million coin days have seen destruction. From the chart, this is notably larger than the 397.4 million all-time high witnessed during the November 2018 crash.
On the surface, it would appear possible that the most dormant of LTHs have just made their biggest-selling move in history. However, looking a bit deeper, it becomes clear that there is a specific reason for this CDD spike: the Mt. Gox transactions.
The bankrupt cryptocurrency exchange had earlier revealed plans to pay creditors, so these latest transfers have likely been related to them.
As the Bitcoin stack in the platform’s custody had been dormant for quite a while, it would have naturally amassed many coin days. The movement of these coins has meant that a record-high number of coin days have been destroyed inside a short window.
BTC Price
At the time of writing, Bitcoin is trading at around $67,500, down 4% over the past week.
Read more
* The content presented above, whether from a third party or not, is considered as general advice only. This article should not be construed as containing investment advice, investment recommendations, an offer of or solicitation for any transactions in financial instruments.


