

Bitcoin (BTC) Price Faces Tough Road to $70,000, Key Indicators Reveal

- Gold Price Forecast: Gold Poised to Break $4,200 as Oil Price Slump Eases Inflation Fears
- Gold declines despite easing concerns over inflation, interest rate hikes
- Fed Decision Eve: 104 Economists Expect No Change; Why Is Citadel Securities Betting on a Surprise Hike?
- Gold Price Forecast: Can Gold Hold $4,020 as Fed Rate Hike Expectations Rise?
- Middle East War updates: US-Iran pause strikes as Trump weighs up diplomatic options
- WTI Oil flirts with the $80 level amid speculation about US-Iran peace talks

Despite Bitcoin’s (BTC) price increase in the last 24 hours, key market indicators are flashing caution, suggesting that the coin may face significant hurdles in reaching the $70,000 mark. This development is contrary to the expectations investors have about the coin this month.
Though Bitcoin’s price has surpassed the $63,000 level again, this analysis discloses the reasons why investors should take these warning signs seriously.
On-Chain Metrics Flash Warning Signs for Bitcoin
One key metric supporting a Bitcoin price retracement is the Network Value to Transactions (NVT) ratio. The NVT ratio shows if the market cap is growing faster than a cryptocurrency’s transaction volume.
When the NVT ratio decreases, transaction volume is growing higher than the market cap. In most cases, this is bullish for the price. On the other hand, a rising NVTV ratio indicates that the Bitcoin network is overhead as the market cap outpaces the volume.
As of this writing, Glassnode data shows that the ratio has increased recently. This suggests potential overvaluation, indicating a possible short-term Bitcoin price correction.
Read more: 5 Best Platforms To Buy Bitcoin Mining Stocks After 2024 Halving
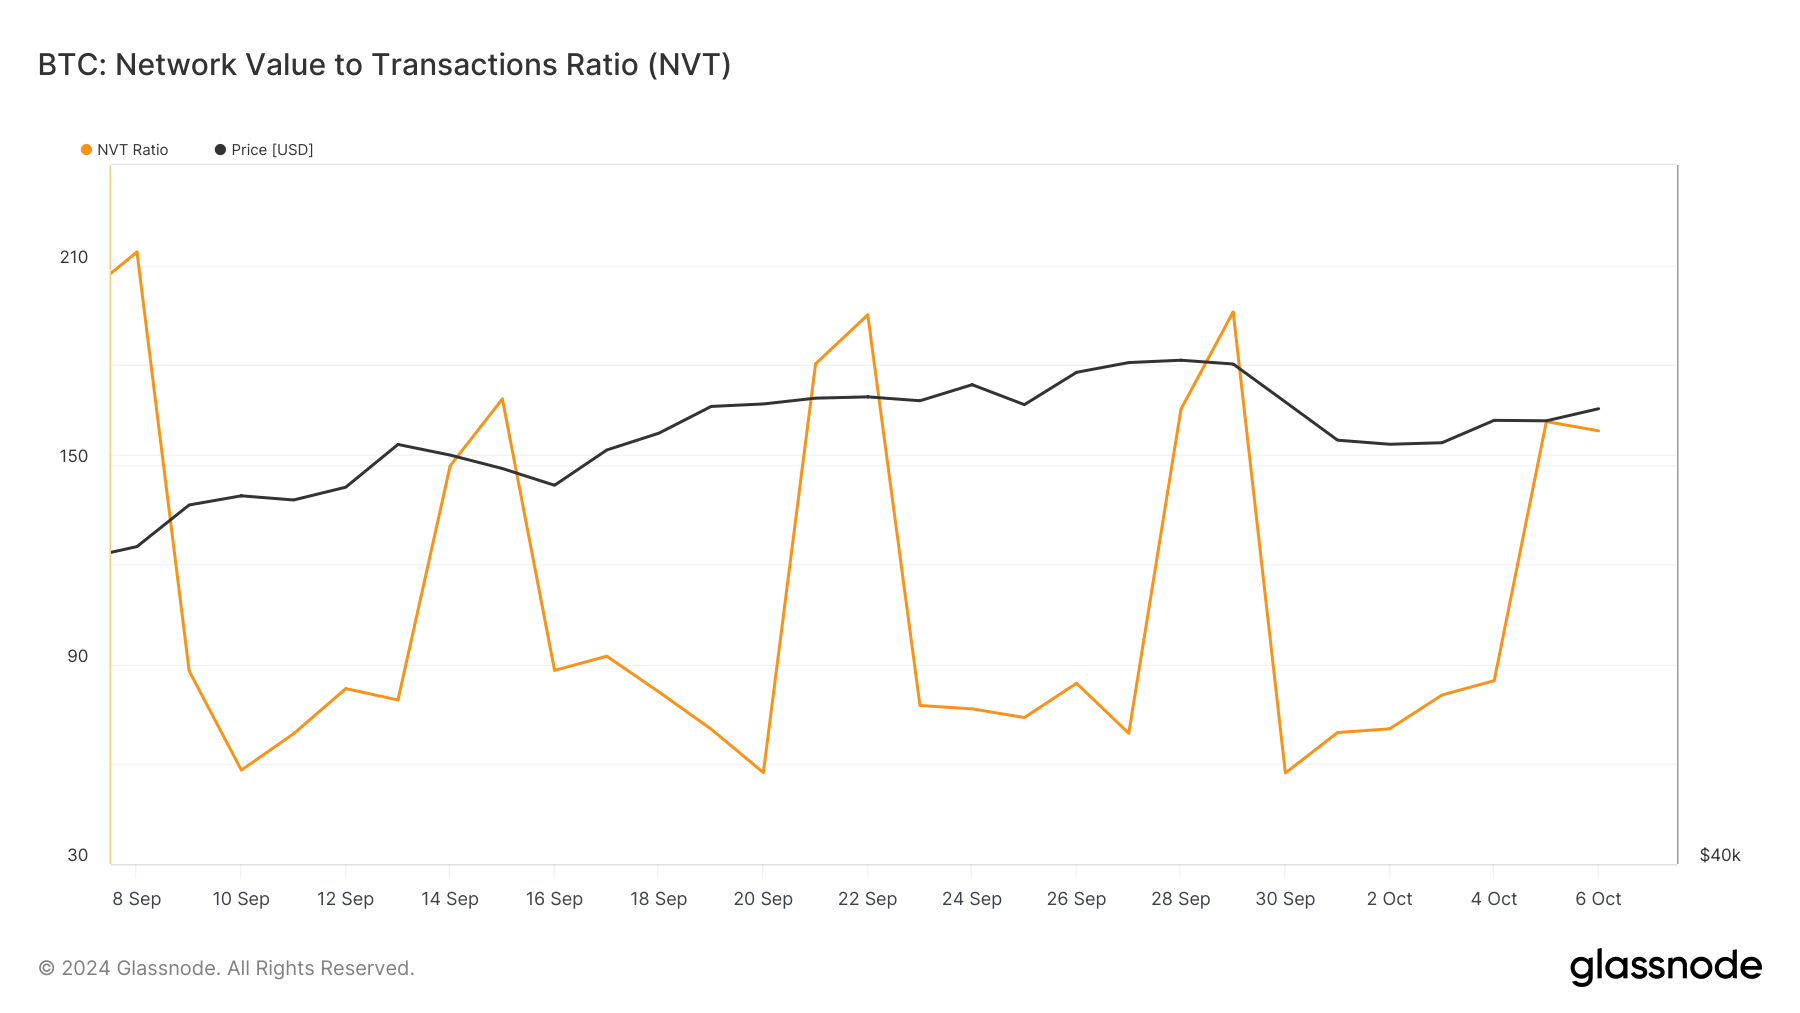 Bitcoin NVT Ratio. Source: Glassnode
This outlook is enhanced by the Short-Term Holder-Spent Output Profit Ratio (STH-SOPR). This metric measures the behavior of short-term investors, indicating whether they are selling at a profit or a loss.
When the STH-SOPR is below 1, investors are selling at a loss. On the other hand, when the metric is below 1, investors are selling at a profit. However, as of this writing, the ratio is exactly 1, suggesting that the volume sold at a loss and in profit matched one another.
Considering the impact on Bitcoin’s price, this development implies that the coin could keep swinging sideways. However, a potential Bitcoin rally toward $70,000 could be implausible.
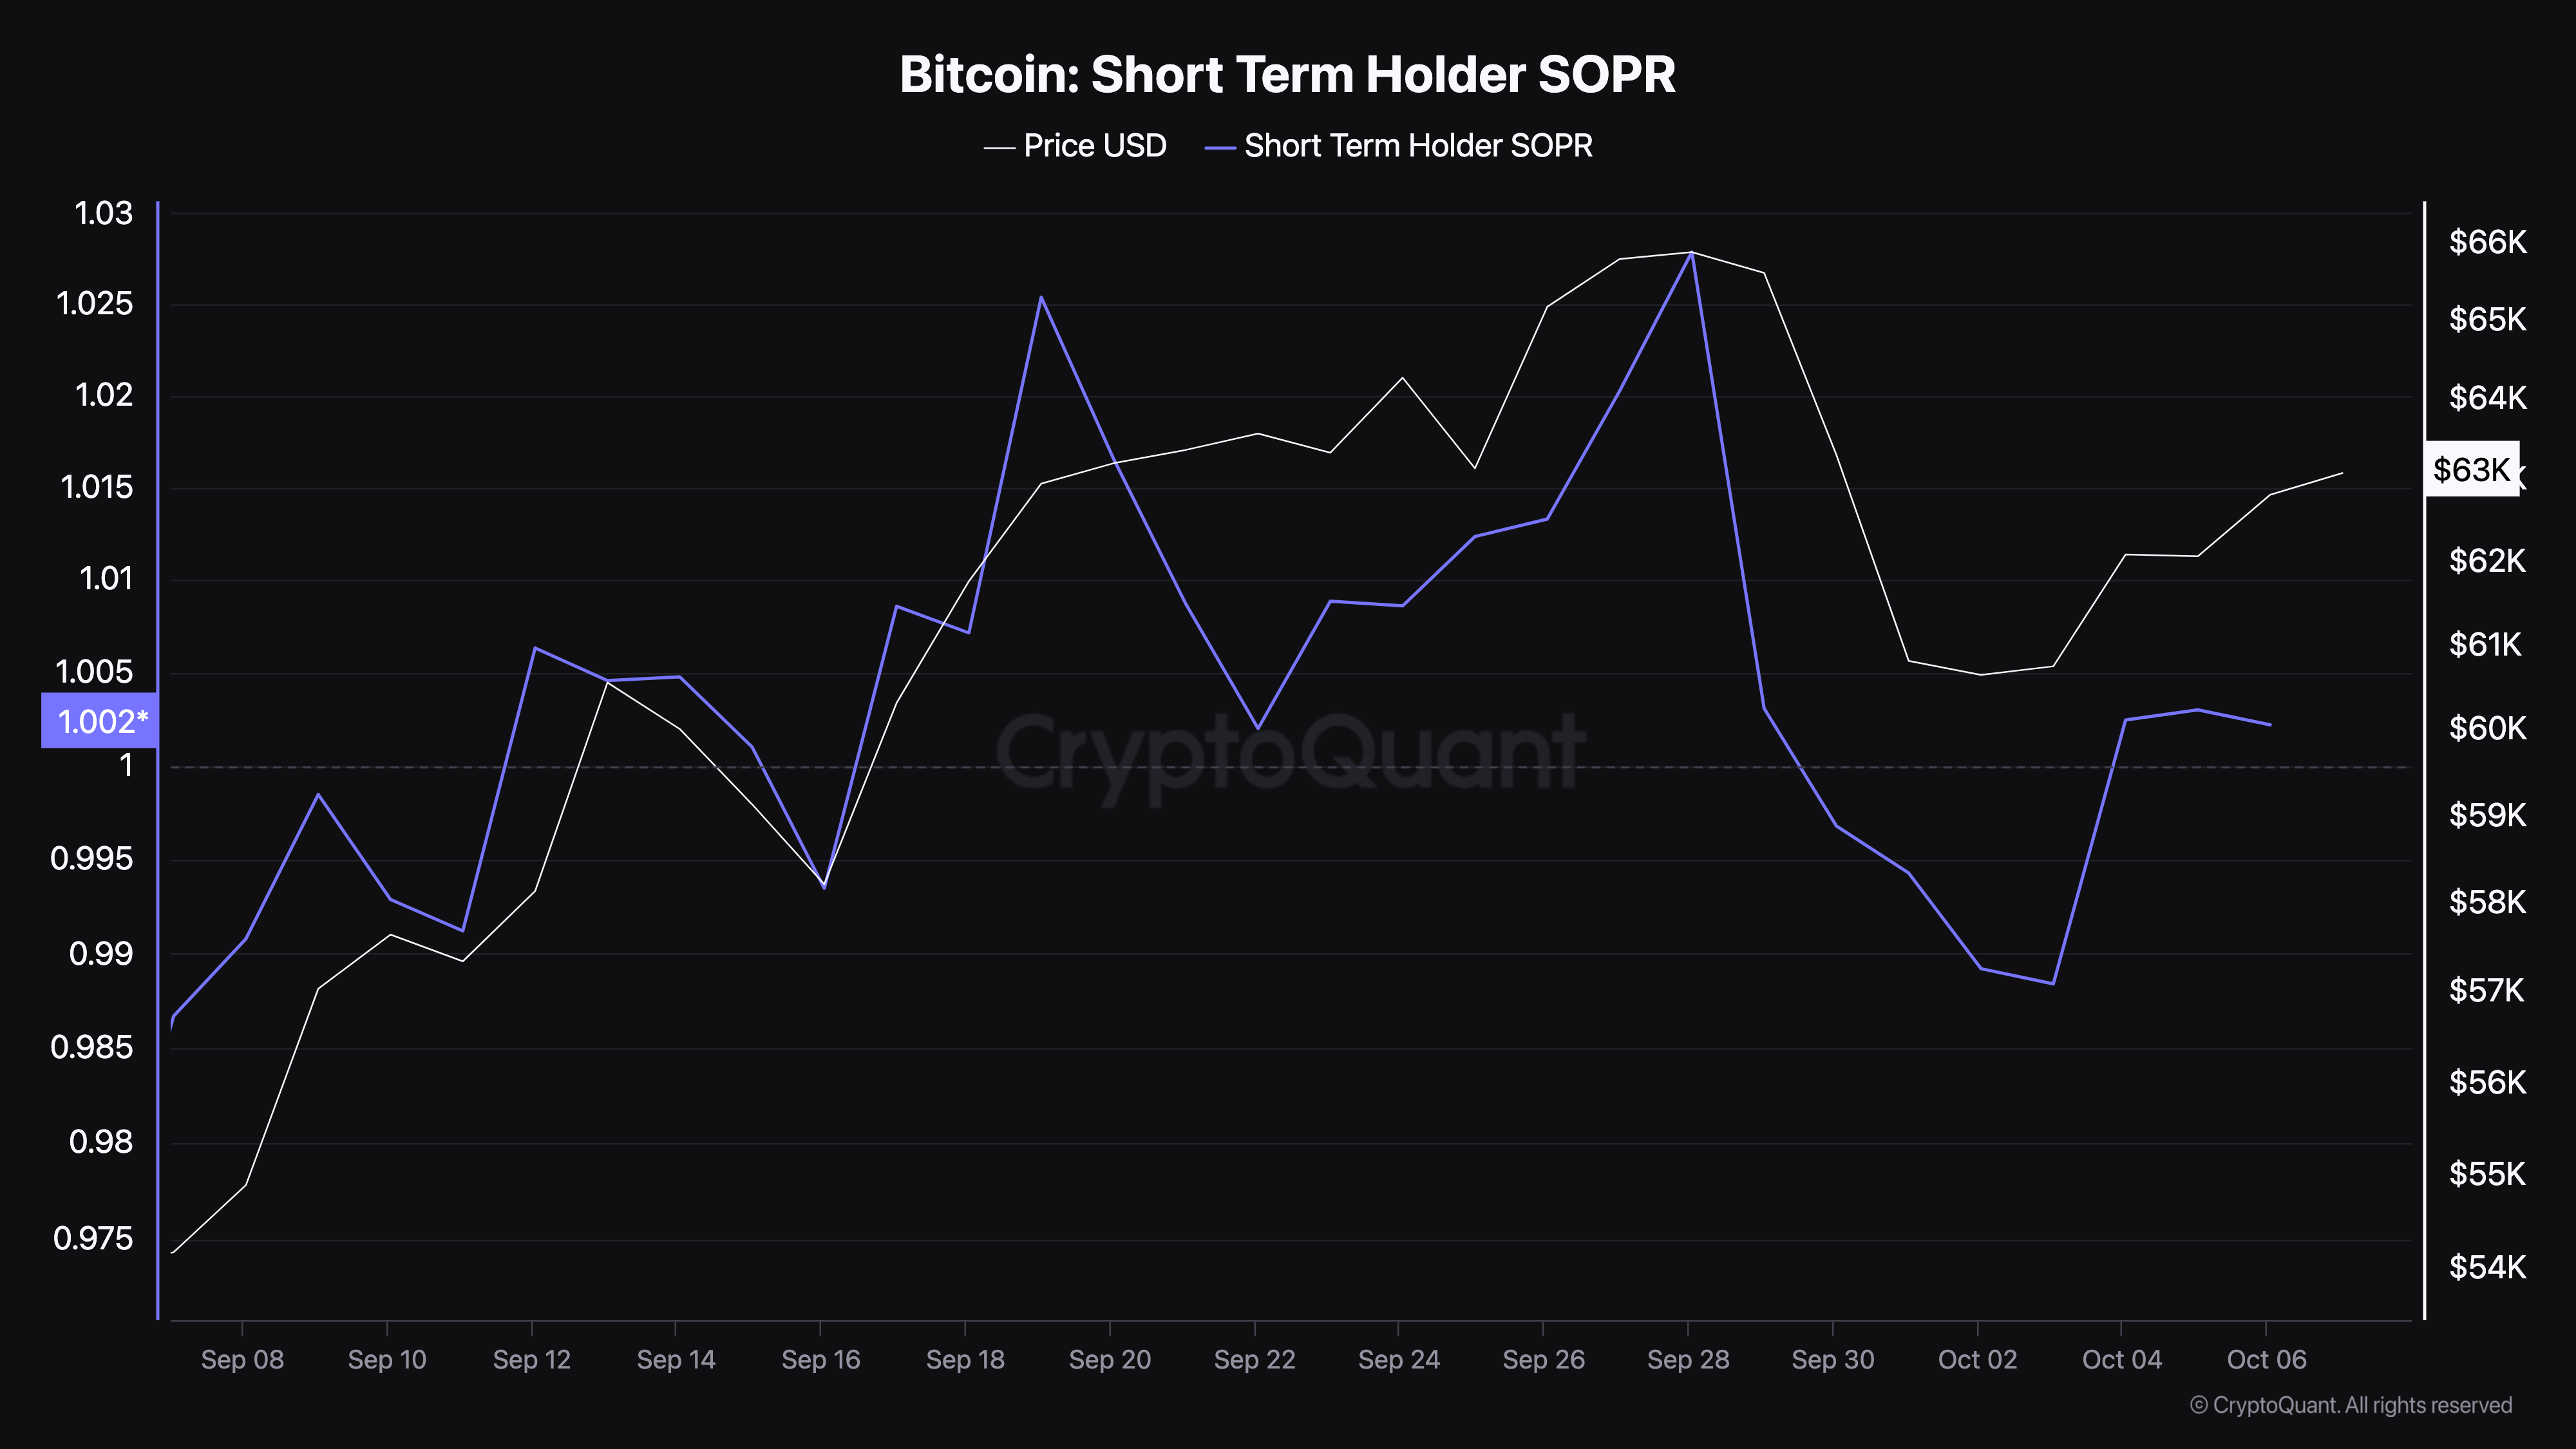 Bitcoin Short-Term Holder SOPR. Source: CryptoQuant
BTC Price Prediction: Coin Could Go Below $60,000
On the daily chart, Bitcoin’s price is currently $62,856, an increase from 24 hours ago. However, the Money Flow Index (MFI) shows that capital flowing into the cryptocurrency has decreased.
The MFI is a technical indicator that uses price and volume to check the level of buying and selling pressure in the market. When the MFI increases, more liquidity is flowing, and the price can increase.
Since the indicator’s reading dropped, it implies that investors are cashing out on recent gains, which could halt the price increase. If this remains the same, BTC’s price might decrease to $59,978.
Read more: 7 Best Crypto Exchanges in the USA for Bitcoin (BTC) Trading
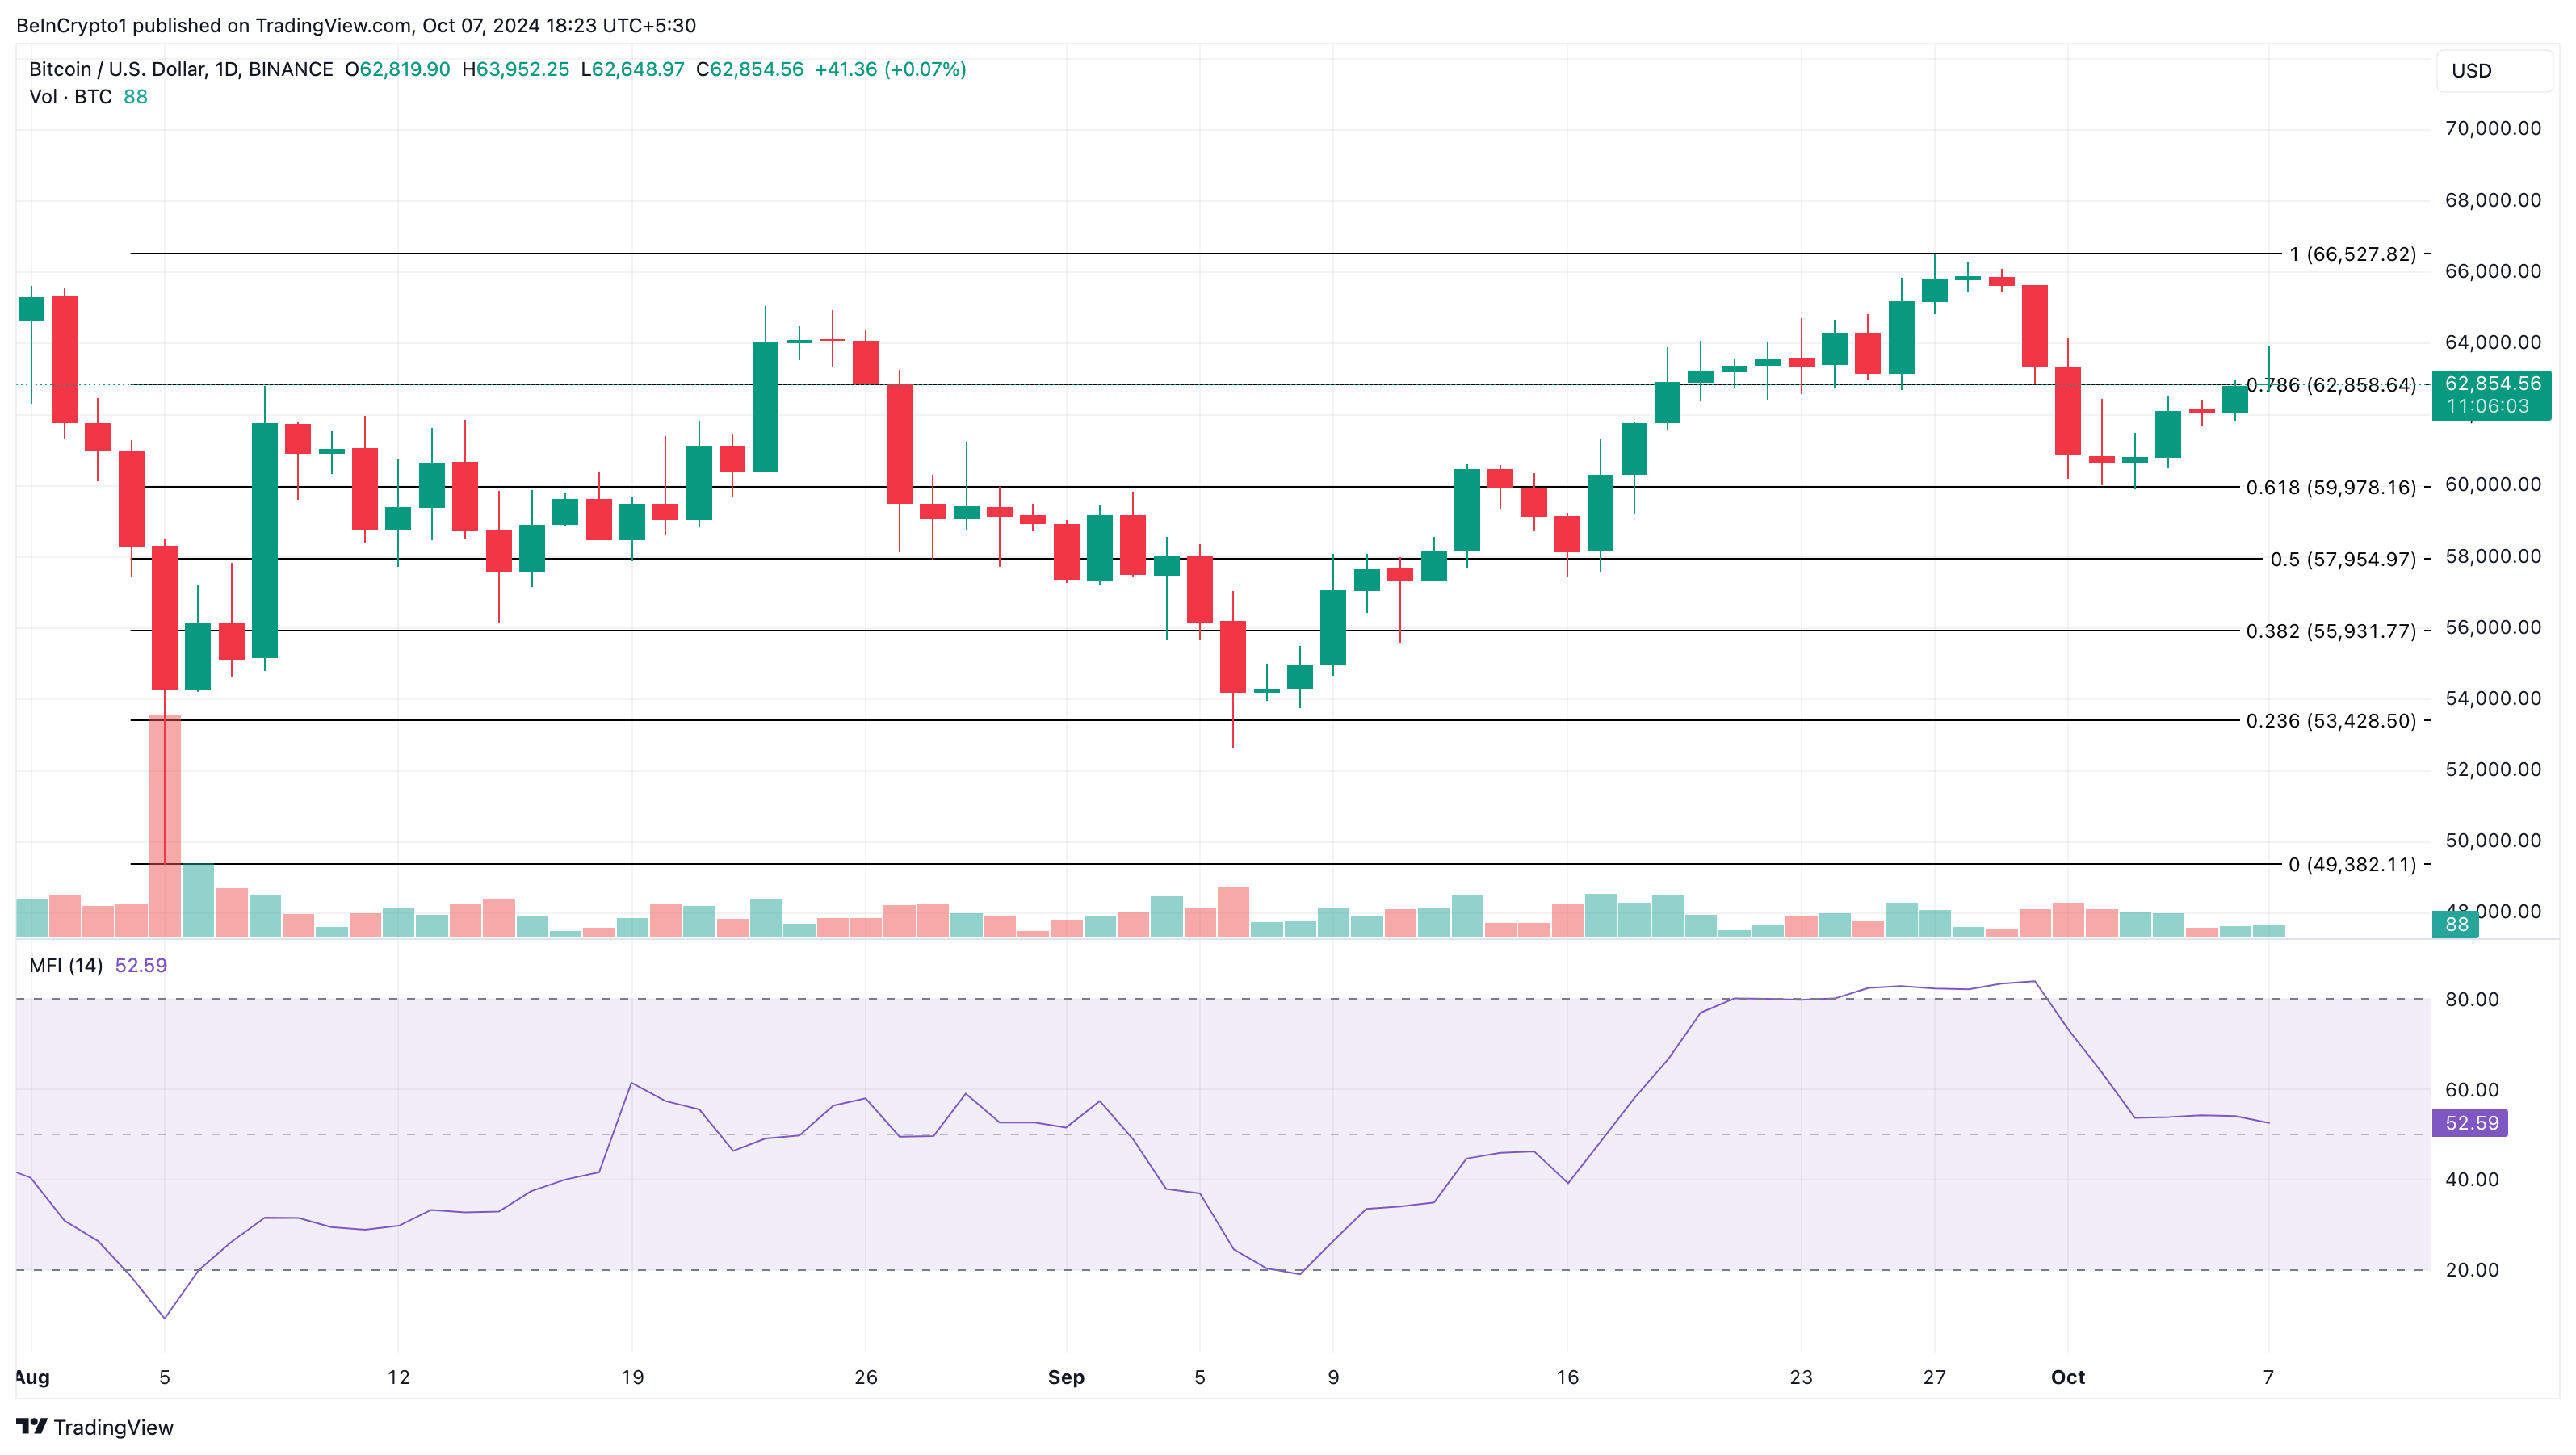 Bitcoin Daily Price Analysis. Source: TradingView
However, if investors stop distributing and start accumulating in large numbers, the coin might appreciate toward $66,527 and eventually $70,000.
Read more
* The content presented above, whether from a third party or not, is considered as general advice only. This article should not be construed as containing investment advice, investment recommendations, an offer of or solicitation for any transactions in financial instruments.


