

Bitcoin Cash Approaching Halving in Less Than Six Months, How Will BCH Price Perform in the Short Term?

- Gold Price Forecast: Gold Poised to Break $4,200 as Oil Price Slump Eases Inflation Fears
- Gold declines despite easing concerns over inflation, interest rate hikes
- Gold Price Forecast: Oil Price Breaking $100 Fuels Inflation Concerns, Will Gold Prices Fall Further?
- Fed Decision Eve: 104 Economists Expect No Change; Why Is Citadel Securities Betting on a Surprise Hike?
- Gold Price Forecast: Can Gold Hold $4,020 as Fed Rate Hike Expectations Rise?
- Middle East War updates: US-Iran pause strikes as Trump weighs up diplomatic options
According to OKLINK data, Bitcoin Cash (BCH) will undergo its second halving on April 5th, 2024, which is less than 168 days away, or just under six months.
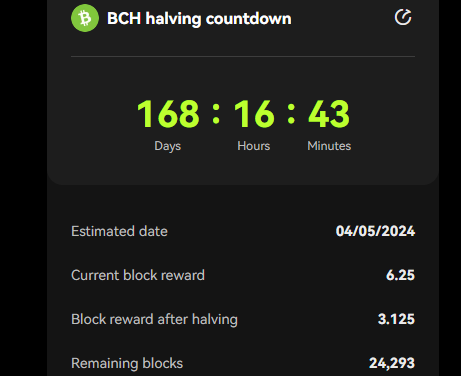
BCH Halving Countdown, Source: OKLINK.
Currently, the block reward for Bitcoin Cash is 6.25 BCH, and after the halving, it will be reduced to 3.125 BCH, meaning that miners will receive half the block rewards. This is the predetermined reward mechanism of the Bitcoin Cash blockchain network, as seen in the table below:

BCH Halving Pattern, Source: Compiled by Mitrade.
Based on historical experience, cryptocurrencies tend to experience significant price increases following a halving event, and BCH is no exception. In the previous halving cycle, BCH surged from $220 (on the day of the halving) to around $1,500, marking a 580% increase and nearly sixfold rise.
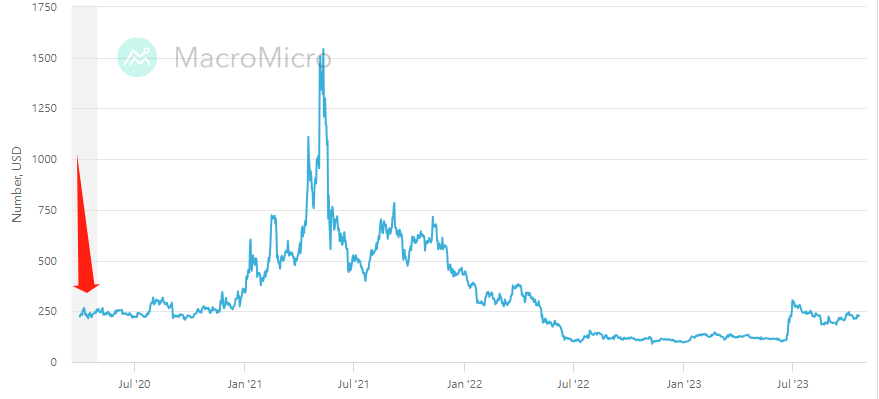
BCH Price Chart Jan 2020 - Oct 2023, Source: MacroMicro.
While it can be expected that there will be a good upward trend after the halving, how should one approach the market dynamics and positions before the halving?
In the first half-year leading up to the previous halving (highlighted in the red box), BCH experienced a small rally, rising from $190 to $460, a 142% increase. However, it quickly retraced back to the starting point, forming a typical "washout" pattern. This last washout phase before the halving is well-known, characterized by rapid and steep declines, often catching investors off guard.
After such a dramatic washout, BCH gradually started to rise again before experiencing an accelerated breakout, reaching its peak and eventually entering a new phase of decline and consolidation.
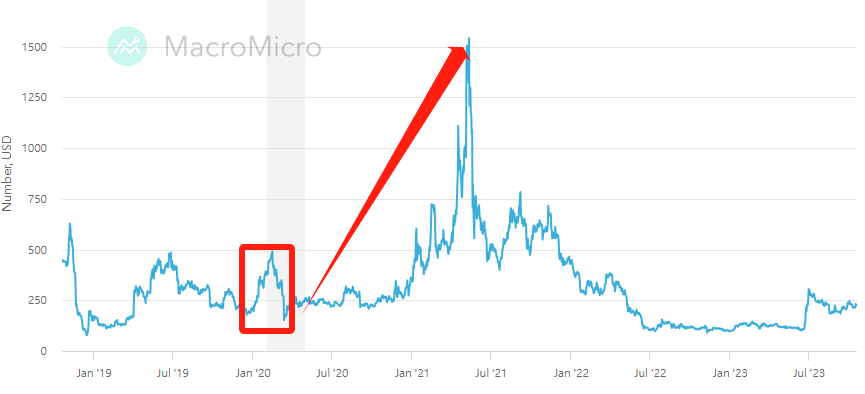
BCH Price Chart Oct 2018 - Oct 2023, Source: MacroMicro.
From June 2022 to June 2023, BCH oscillated in a range of $80-$160 for a year. On June 24th, 2023, BCH broke out of this range with a strong bullish candle, reaching $320 on June 30th. On August 17th, it dropped to $160, which has now become a strong support level.
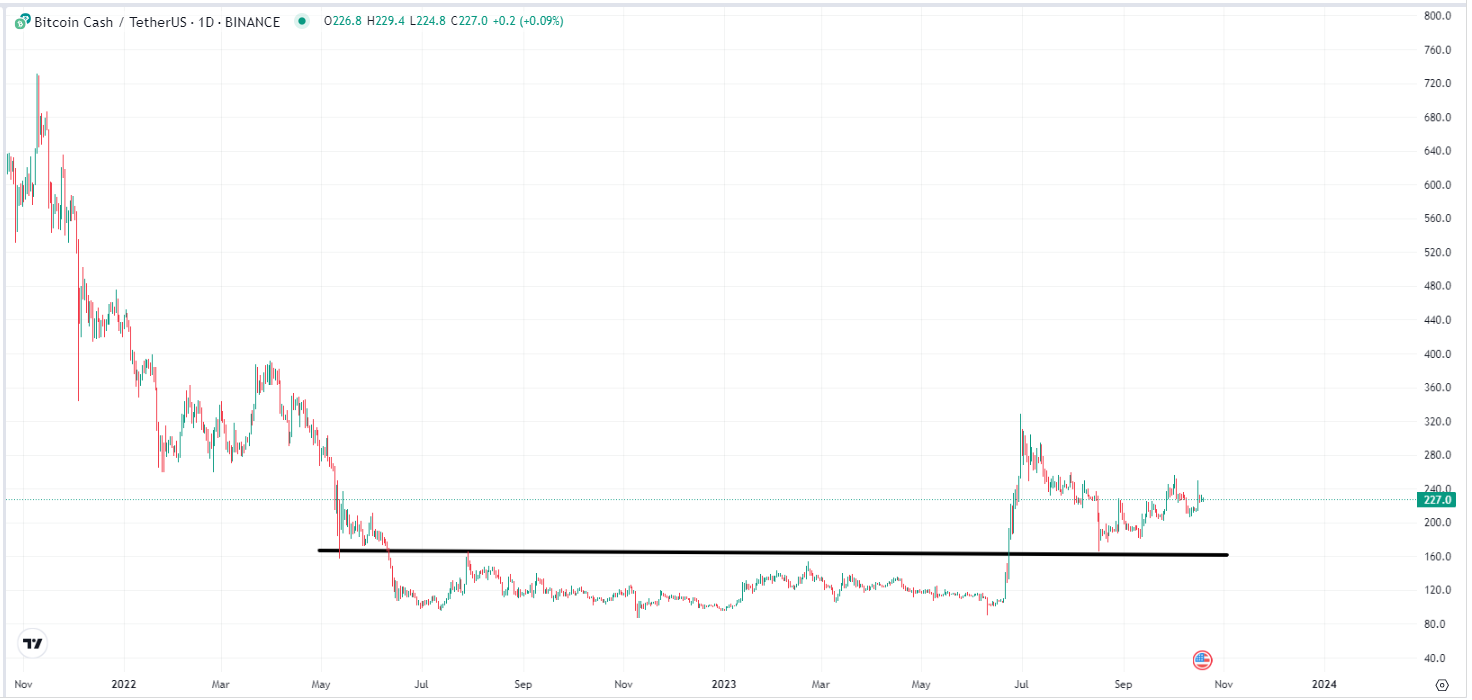
BCH Price Chart Nov 2021 - Oct 2023, Source: TradingView.
With still six months remaining until the BCH halving, it is unlikely that BCH will experience a rapid decline and washout similar to the previous cycle. Looking at the current trend, the likelihood of BCH dropping below $160 is not high, especially considering the potential positive impact of the BTC spot ETF and the anticipation of monetary policy easing in the United States, which could benefit the overall market.
Therefore, short-term investors may consider buying BCH near the support level around $160. Long-term investors should also build positions around that level while keeping some funds available to mitigate any black swan events that could lead to a market downturn and allow for additional purchases if BCH were to drop back to the low level of $80.
Read more
* The content presented above, whether from a third party or not, is considered as general advice only. This article should not be construed as containing investment advice, investment recommendations, an offer of or solicitation for any transactions in financial instruments.


