



WTI back over $83 as Crude Oil sees additional volatility

Mitrade
coverImg
Source: DepositPhotos

■Crude Oil gets pulled in both directions on Tuesday.


■A misfire in US PMIs spark fresh rate cut hopes.


■Risk assets get pumped higher as markets celebrate softening US economy.


West Texas Intermediate (WTI) US Crude Oil started Tuesday on the low side, falling below $81.00 per barrel before a broad-market recovery in risk appetite dragged barrel bids into a fresh high above $83.00. US Purchasing Managers Index (PMI) figures printed much softer than expected, sparking renewed hopes of a weakening US economy forcing the US Federal Reserve (Fed) to begin cutting rates sooner than previously expected.


Crude Oil markets remain exposed to downside moves as recent geopolitical tensions ease after Iran announced it would not seek further retaliation against Israel. WTI’s recent climb sparked by ongoing fears of a Middle East conflict spilling over into an all-out war faltered near $87.00 per barrel as cooler heads prevail. 


US data is set to continue driving financial markets through the rest of the trading week. US Gross Domestic Product (GDP) figures are slated for Thursday, where investors are expecting, or hoping, for US GDP for the annualized first quarter to ease to 2.5% from the previous 3.4%. On Friday, US Personal Consumption Expenditure (PCE) Price Index inflation data will be released, which is forecast to hold steady at 0.3% MoM.


WTI technical outlook


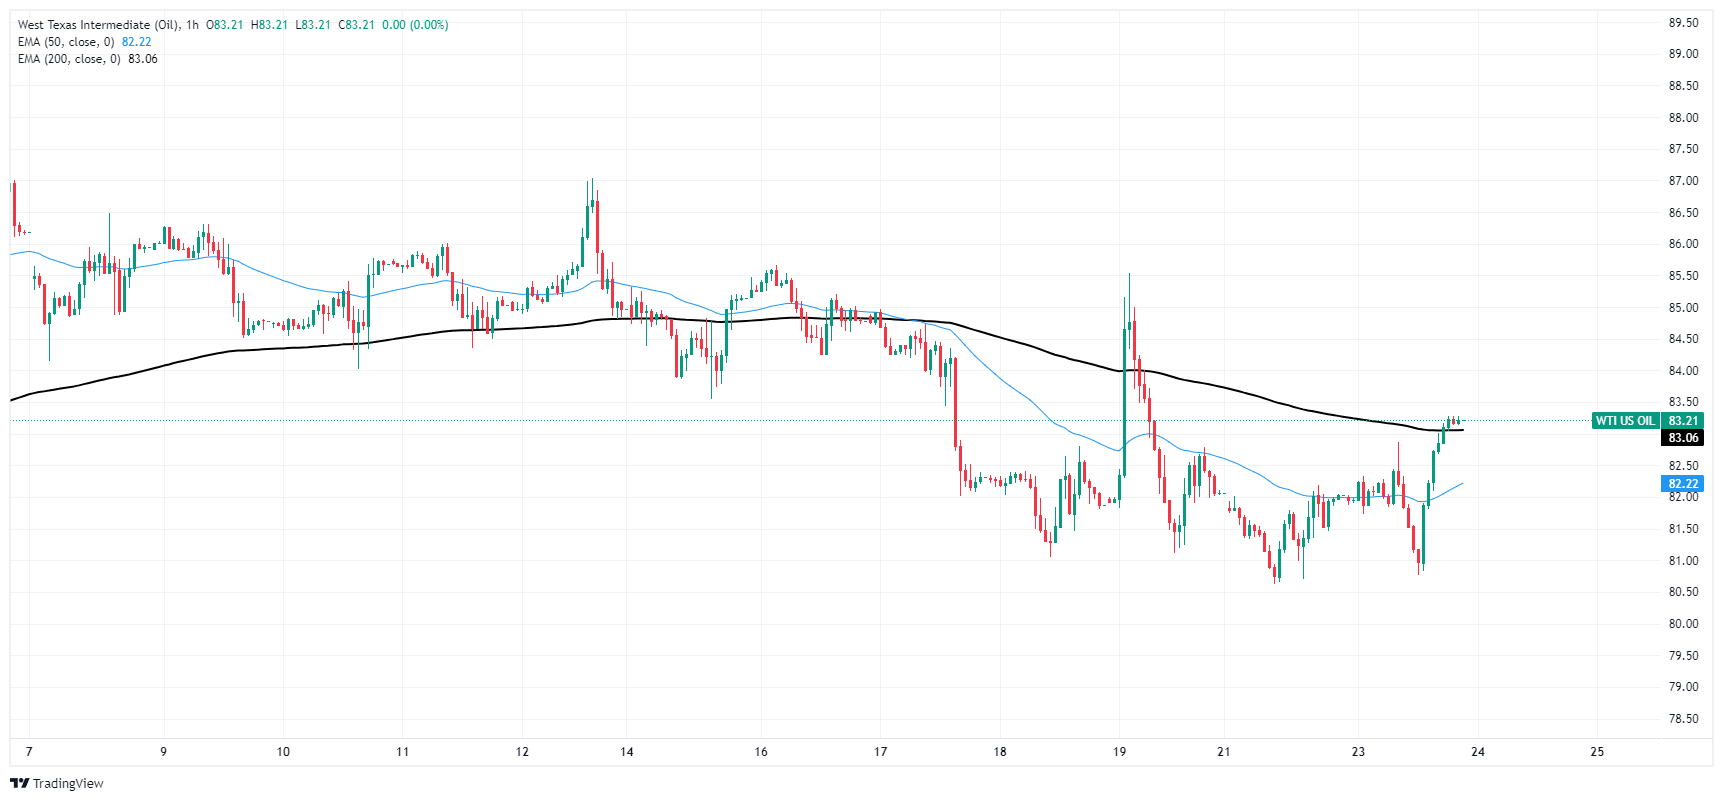
WTI crossed $83.00 per barrel after recovering from Tuesday’s bottom bids just below $81.00. The day’s late-stage rally brought US Crude Oil prices just above the 200-hour Exponential Moving Average (EMA). 


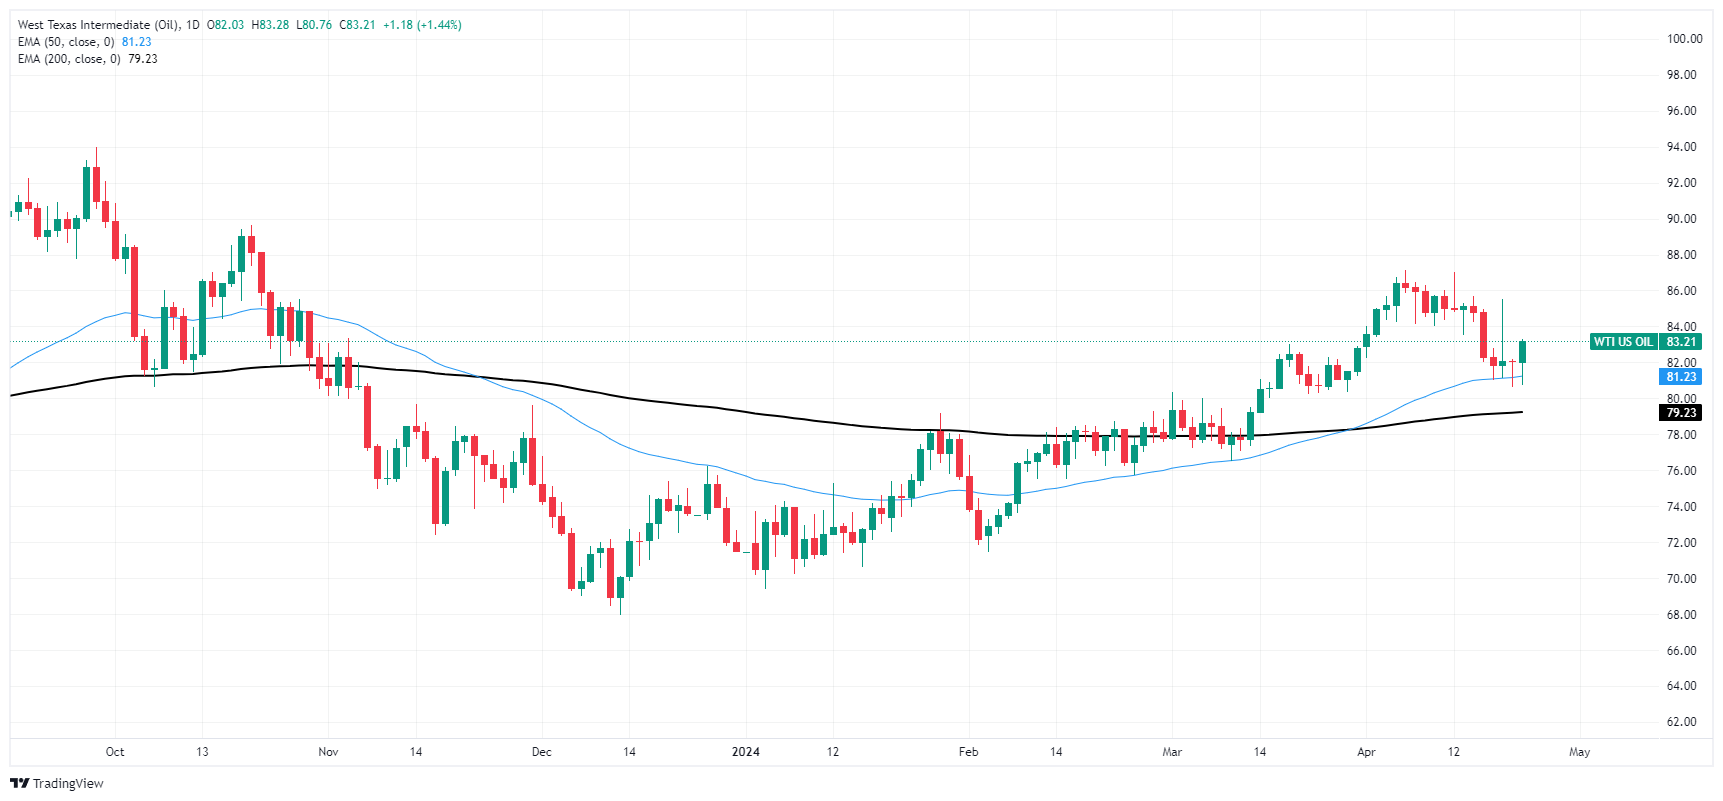
Despite Tuesday’s late rally, US Crude Oil remains knocked off of recent gains, with WTI down around 4.5% from April’s swing highs near $87.00 per barrel. On the low side, long-term technical support sits at the 200-day EMA, holding near $79.23.


WTI hourly chart


WTI daily chart


Read more

  • Will US Stocks Rise After Midterm Elections? Analysis of Historical Election Data and Market Patterns
  • * The content presented above, whether from a third party or not, is considered as general advice only.  This article should not be construed as containing investment advice, investment recommendations, an offer of or solicitation for any transactions in financial instruments.

    goTop
    quote
    Related Articles
    placeholder
    WTI Crude Plunges 6% Below $100: What Caused the Sharp Drop in Oil Prices?On November 2, Eastern Time, international oil prices fell sharply. As of press time, Brent crude futures (UKOIL) fell 6.3% to $106.2 per barrel; U.S. WTI crude futures (USOIL) fell 6.4%
    Author  TradingKey
    5 hours ago
    On November 2, Eastern Time, international oil prices fell sharply. As of press time, Brent crude futures (UKOIL) fell 6.3% to $106.2 per barrel; U.S. WTI crude futures (USOIL) fell 6.4%
    placeholder
    WTI Crude Pulls Back From Highs Near $100 as US and Iran Plan Talks, Risking 20% CorrectionUS and Iran plan to resume negotiations to ease geopolitical tensions; WTI crude plummets nearly 2% in response, facing a potential 20% deep pullback on technicals.On November 2, driven b
    Author  TradingKey
    23 hours ago
    US and Iran plan to resume negotiations to ease geopolitical tensions; WTI crude plummets nearly 2% in response, facing a potential 20% deep pullback on technicals.On November 2, driven b
    placeholder
    Brent slips to $111 as a two-day Hormuz plan lands — the supply-risk premium is the only thing being soldBrent fell 1.95% to $111.20 and WTI to $101.92 after Iran's foreign minister said a Qatar-brokered plan could reopen the Strait of Hormuz in two days. Two tankers were still reported hit by mines. The move is a premium unwind, not a supply change.
    Author  Irene Q.
    Yesterday 03: 02
    Brent fell 1.95% to $111.20 and WTI to $101.92 after Iran's foreign minister said a Qatar-brokered plan could reopen the Strait of Hormuz in two days. Two tankers were still reported hit by mines. The move is a premium unwind, not a supply change.
    placeholder
    Today’s Market Recap: Three Major US Indexes Plunge, Philadelphia Semiconductor Index Tumbles Over 7%, Oil Falls, Gold and Silver AdvanceWith the U.S. midterm elections approaching, the three major U.S. stock indices and the Philadelphia Semiconductor Index collectively suffered sharp falls last Frida
    Author  TradingKey
    Yesterday 01: 29
    With the U.S. midterm elections approaching, the three major U.S. stock indices and the Philadelphia Semiconductor Index collectively suffered sharp falls last Frida
    placeholder
    Brent's $115 front month sits $4.6 above January — the $14 spread to WTI is the supply-risk premiumDecember Brent trades at $115.29 while January is $110.71, a $4.58 backwardation. The December Brent-WTI spread is $14.2, versus a $3-5 normal. That gap, not the headline, is where the Middle East supply risk is priced. Here is what the curve says, why the December contract's expiry on October 30 will mechanically cut the headline by $4.6, and the 108.81 neckline that decides the next move.
    Author  Irene Q.
    Oct 28, Wed
    December Brent trades at $115.29 while January is $110.71, a $4.58 backwardation. The December Brent-WTI spread is $14.2, versus a $3-5 normal. That gap, not the headline, is where the Middle East supply risk is priced. Here is what the curve says, why the December contract's expiry on October 30 will mechanically cut the headline by $4.6, and the 108.81 neckline that decides the next move.
    Live Quotes
    Name / SymbolChart% Change / Price
    UKOIL
    UKOIL
    0.00%0.00
    USOIL
    USOIL
    0.00%0.00

    Oil Related Articles

    • Best Oil Trading Platforms in 2026: A Complete Guide for Retail Traders
    • Should I Invest in Oil Right Now? The 2026 Oil Price Forecast
    • Crude Oil Trading: How To Invest In WTI/Brent Oil?
    • WTI Moves Upward Near $75.50 on Dovish Fed Outlook, Maersk, CMA CGM Return to Red Sea

    Click to view more