Natural Gas trades on the front foot, with market activity picking up interest

Mitrade
coverImg
Source: DepositPhotos

●Natural Gas prices are steady, holding on to a three-day winning streak. 


●Traders see Asian buyers crowding the demand side in the European gas markets. 


●The US Dollar Index sinks below 104.00 ahead of US PCE inflation numbers.


Natural Gas (XNG/USD) trades on the front foot on Thursday driven by a pickup in activity and demand, showing how resilient the commodity actually can be. First and foremost, TotalEnergies signed a deal with Singapore’s Sembcorp for a whopping 16-year commitment for sale and purchase of Liquefied Natural Gas (LNG). This adds to the headlines from Wednesday, which pointed to  more and more Asian traders looking to profit from the cheaper Gas contracts in the European market.


Meanwhile, the US Dollar (USD) is facing a pivotal moment this Thursday with the US Personal Consumption Expenditures (PCE) Price Index data to be released later. After the hot inflation report from two weeks ago, markets are already pricing in that interest rates in the US will remain at the current levels for longer than previously expected. Some traders are even considering the possibility of a surprise rate hike from the Federal Reserve. In this context, the question is whether the US Dollar can still rally despite these already supportive elements.


Natural Gas is trading at $1.92 per MMBtu at the time of writing. 


Natural Gas market movers: Equilibrium in Europe becomes fragile


●LNG flows into Europe have been 16% higher than the 30-day average these past few days, according to Bloomberg.


●European gas storages are still filled up to nearly 63% as the heating season in the old continent comes to an end. 


●Freeport LNG in Texas has reported that it will need to extend its production of LNG another two weeks after issues with its Train 3 unit.


●At 15:30 GMT, the weekly Natural Gas Storage Change will be released by the Energy Information Administration. The previous number was a draw of 60 Billion cubic feet, with expectations for a larger draw of 88 Billion cubic feet for this week.


Natural Gas Technical Analysis: European Gas market could see balance shift


Natural Gas prices are already pricing in the fact that more Asian trading desks and companies are trying to set foot in Europe to get their hands on substantially cheaper Gas contracts. Meanwhile, the European supply out of the US could be at risk as deliveries to Asia become more beneficial for US sellers, with Asian handlers willing to pay more for US gas than Europe is at the moment. This could soon see the scale tipping into less supply. Combined with an overcrowded demand, this could mean Gas prices soaring further above $2.


On the upside, Natural Gas is facing some pivotal technical levels to get back to. The next step is $1.99, – the level which, when broken on the way down, saw an accelerated decline. After that, the green line at $2.13 comes into view, with the triple bottoms from 2023. If Natural Gas sees a sudden demand pickup, $2.40 could come into play.


On the downside, $1.64 and $1.53 (the low of 2020) are targets to look out for. Another leg lower could come if global growth starts to falter and there is less demand. Adding to that equation, more volume of Natural Gas from the US and Canada could quickly tip into an oversupplied market with more downside prices at hand.
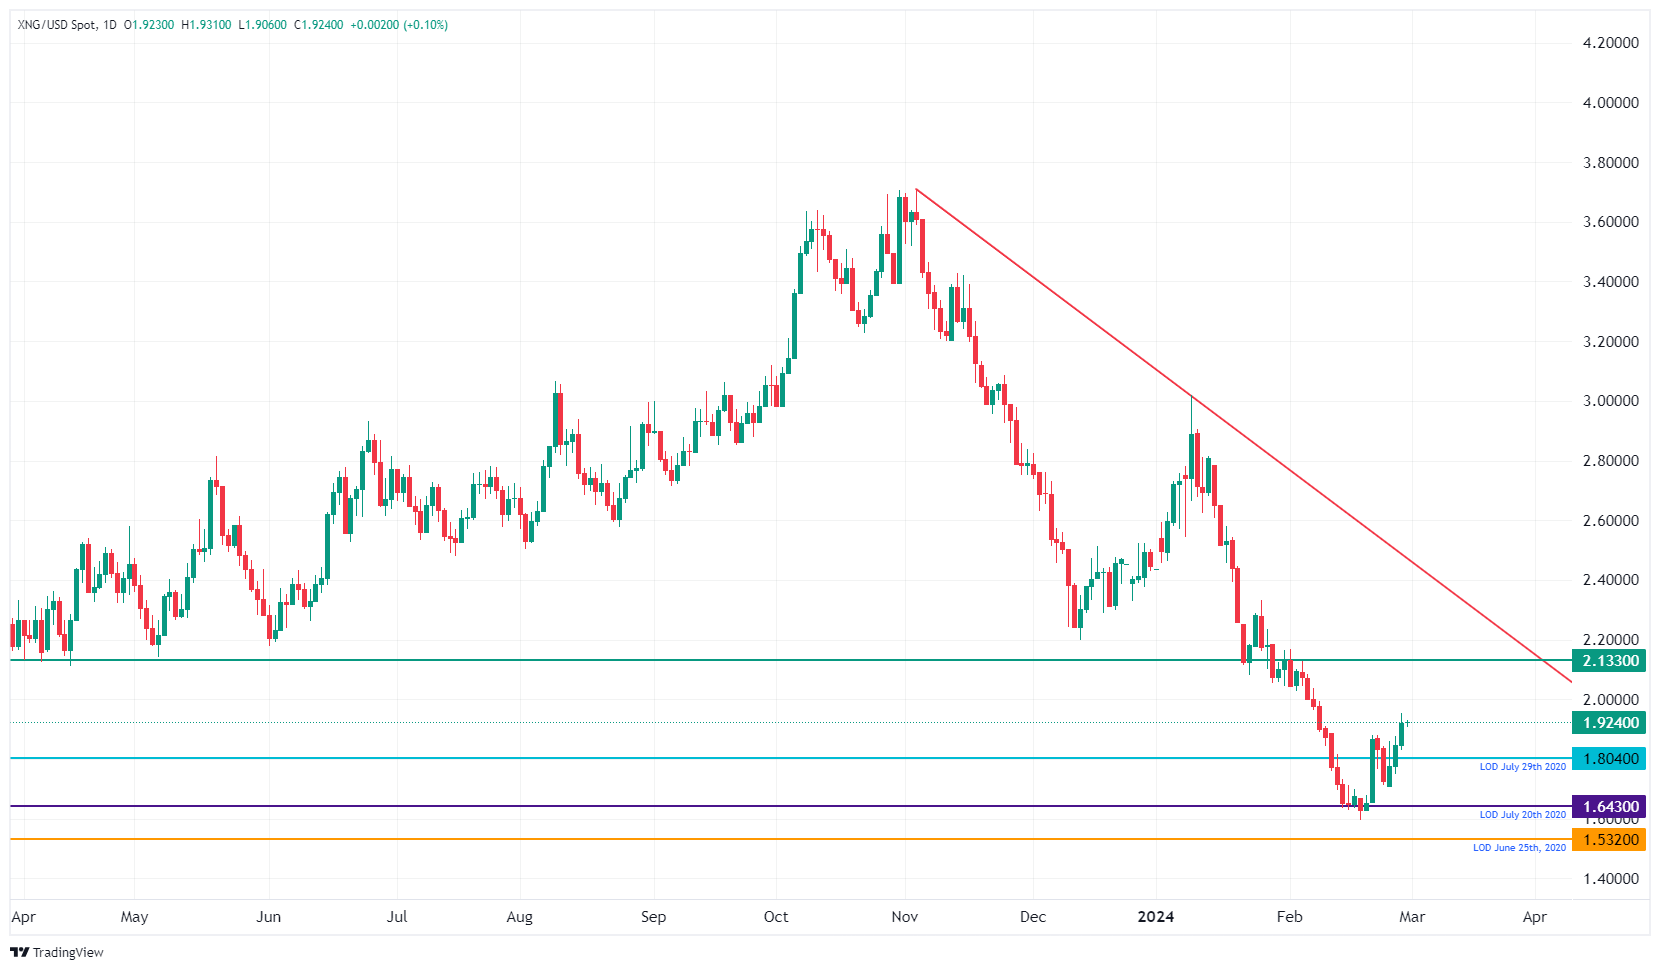

XNG/USD (Daily Chart)

XNG/USD (Daily Chart)


Read more

  • Gold Price Forecast: Gold Tumbles Below $3,900 as Trump Says No Need for Iran Deal; Can October PPI Spur a Rebound?
  • Brent rose 3.3% and US crude stocks built 4.66 million barrels in the same week
  • Gold hit a one-year low while central banks bought 321 tonnes — the sellers were never the ones you think
  • * The content presented above, whether from a third party or not, is considered as general advice only.  This article should not be construed as containing investment advice, investment recommendations, an offer of or solicitation for any transactions in financial instruments.

    goTop
    quote
    Related Articles
    placeholder
    Brent rose 3.3% and US crude stocks built 4.66 million barrels in the same weekBrent January settled at 95.82, up 3.3%, and WTI at 88.74, up 2.55%, after the US signalled it would not pursue a deal with Iran and attacks on Gulf shipping continued. In the same week, EIA data showed US crude inventories rising 4.657 million barrels against expectations of a 1.1 million draw, with gasoline up another 1.799 million. OPEC output also rebounded 1.96 million barrels a day to 27.16 million in October, led by Saudi Arabia at 10.56 million. This piece separates the geopolitical premium from the physical balance and lays out where each side of the trade is anchored.
    Author  Irene Q.
    Yesterday 03: 06
    Brent January settled at 95.82, up 3.3%, and WTI at 88.74, up 2.55%, after the US signalled it would not pursue a deal with Iran and attacks on Gulf shipping continued. In the same week, EIA data showed US crude inventories rising 4.657 million barrels against expectations of a 1.1 million draw, with gasoline up another 1.799 million. OPEC output also rebounded 1.96 million barrels a day to 27.16 million in October, led by Saudi Arabia at 10.56 million. This piece separates the geopolitical premium from the physical balance and lays out where each side of the trade is anchored.
    placeholder
    US President Donald Trump says military action against Iran doesn't seem to be necessaryUS President Donald Trump said that further strikes on Iran wouldn’t be necessary, but the US remains “locked and loaded,” Bloomberg reported on Monday. Trump added that there is "positive momentum" towards an end to the Iran war.
    Author  FXStreet
    Nov 10, Tue
    US President Donald Trump said that further strikes on Iran wouldn’t be necessary, but the US remains “locked and loaded,” Bloomberg reported on Monday. Trump added that there is "positive momentum" towards an end to the Iran war.
    placeholder
    Weekly Report: Gold up 4.5%, Brent down 16.4% — three commodity regimes just resetGold rose 4.51% to $4,074.90 while Brent fell 16.42% to $98.32 in the same five sessions — two inflation hedges, opposite answers. Around them, the gold-silver ratio sits at 78.7 and copper fell 3.72%. Three regime signals, two of them close to flipping, define what commodity traders must re-price before Tuesday's CPI.
    Author  Irene Q.
    Nov 09, Mon
    Gold rose 4.51% to $4,074.90 while Brent fell 16.42% to $98.32 in the same five sessions — two inflation hedges, opposite answers. Around them, the gold-silver ratio sits at 78.7 and copper fell 3.72%. Three regime signals, two of them close to flipping, define what commodity traders must re-price before Tuesday's CPI.
    placeholder
    WTI struggles below $87.50 as Democrats seek end to Iran war after midterm sweepWest Texas Intermediate (WTI) – the benchmark US Crude Oil price – remains depressed for the second straight day on Thursday, trading just below mid-$87.00s during the Asian session and close to a near one-month low touched the previous day.
    Author  FXStreet
    Nov 05, Thu
    West Texas Intermediate (WTI) – the benchmark US Crude Oil price – remains depressed for the second straight day on Thursday, trading just below mid-$87.00s during the Asian session and close to a near one-month low touched the previous day.
    placeholder
    Brent at $103.60: the peace trade is selling paper, but the physical market just drew 5.3 million barrelsBrent settled at $103.60, its lowest close since October 7 and an 8% weekly drop on US-Iran talks. Yet API crude stocks fell 5.267 million barrels versus a 2.1 million build expected.
    Author  Irene Q.
    Nov 04, Wed
    Brent settled at $103.60, its lowest close since October 7 and an 8% weekly drop on US-Iran talks. Yet API crude stocks fell 5.267 million barrels versus a 2.1 million build expected.
    Live Quotes
    Name / SymbolChart% Change / Price
    NATGAS
    NATGAS
    0.00%0.00

    Oil Related Articles

    • Best Oil Trading Platforms in 2026: A Complete Guide for Retail Traders
    • Should I Invest in Oil Right Now? The 2026 Oil Price Forecast
    • Crude Oil Trading: How To Invest In WTI/Brent Oil?
    • WTI Moves Upward Near $75.50 on Dovish Fed Outlook, Maersk, CMA CGM Return to Red Sea

    Click to view more