How long can the short-term rebound in gold last?

Mitrade
Trending Articles
coverImg
Source: DepositPhotos

On Thursday (August 24th), the release of initial jobless claims and July durable goods orders data from the United States had mixed results, initially suppressing the rebound in gold.


The data showed that preliminary durable goods orders for July in the US fell by 5.2% compared to the previous month, marking the largest decline since April 2020, with an estimated decline of 4.0%. The previous value had risen by 4.6%.


It is worth mentioning that the number of initial jobless claims reported by the US Department of Labor dropped to its lowest level in three weeks, indicating a continued tight labor market. The data revealed that 230,000 initial jobless claims were recorded for the week ending August 19th, lower than the market's expectation of 240,000 and the previous value of 239,000. Additionally, the number of continuing jobless claims for the week ending August 12th was 1.702 million, also below the market's expectation of 1.708 million and the previous value of 1.716 million.


Following the release of the above data, the US dollar index briefly surged to 103.94, causing gold to decline to 1911.


In fact, despite the Federal Reserve raising interest rates by a cumulative 525 basis points since March 2022, the labor market performance remains robust, coupled with a decline in inflation. The market holds a generally optimistic outlook for the US economy, which weakens the safe-haven sentiment that previously supported gold in the medium to long term.


Looking back at this short-term rebound in gold, its main cause was the impact of falling yields on the 10-year and 2-year US Treasury bonds. However, as mentioned earlier, the market holds a generally optimistic outlook for the US economy, which will support the US dollar, making it difficult for the short-term rebound in gold to sustain.


From a technical perspective, the confirmation of the short-term rebound in gold occurred on Wednesday (August 23rd), and it is currently operating within an ascending channel. The key resistance level for gold at present is 1923, with support levels at 1915 and then 1910.


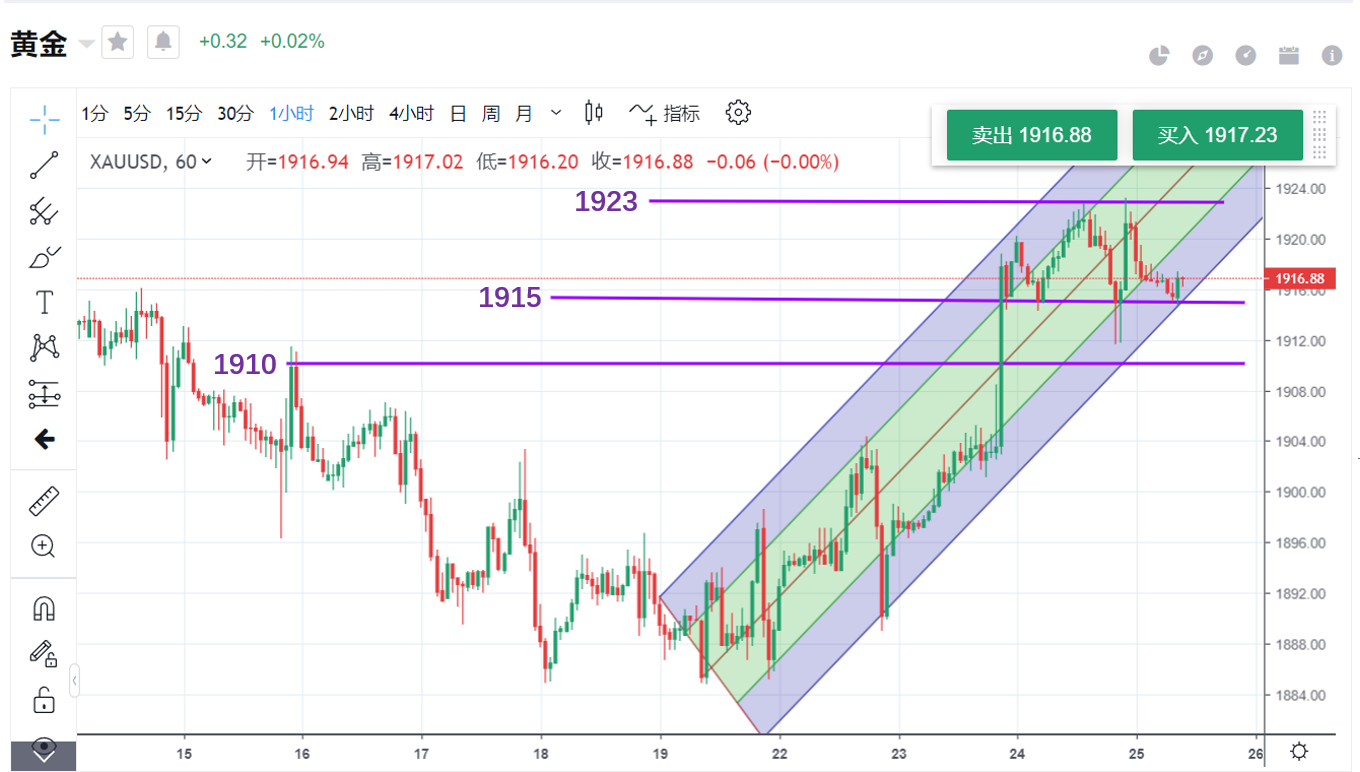
Source: MitradeWebtrader


Read more

  • Top 3 Price Prediction: BTC, ETH and XRP remain range-bound as breakdown risks rise
  • Note: If you want to share the article 《How long can the short-term rebound in gold last?》, make sure you retain the original link. For more information, please visit Insights or browse www.mitrade.com.

    * The content presented above, whether from a third party or not, is considered as general advice only.  This article should not be construed as containing investment advice, investment recommendations, an offer of or solicitation for any transactions in financial instruments.

    goTop
    quote
    Related Articles
    placeholder
    Gold drifts higher to $5,000 on heightened US-Iran tensions Gold price (XAU/USD) holds positive ground near $5,000 during the early Asian session on Friday. The precious metal edges higher as escalating tensions between the United States (US) and Iran boost safe-haven demand.
    Author  FXStreet
    Feb 20, Fri
    Gold price (XAU/USD) holds positive ground near $5,000 during the early Asian session on Friday. The precious metal edges higher as escalating tensions between the United States (US) and Iran boost safe-haven demand.
    placeholder
    Gold rises above $4,950 as US-Iran tensions boost safe-haven demandGold price (XAU/USD) holds positive ground near $4,985 during the early Asian session on Thursday. The precious metal recovers amid shifts in geopolitical sentiment, boosting safe-haven demand.
    Author  FXStreet
    Feb 19, Thu
    Gold price (XAU/USD) holds positive ground near $4,985 during the early Asian session on Thursday. The precious metal recovers amid shifts in geopolitical sentiment, boosting safe-haven demand.
    placeholder
    Gold declines to near $4,850 as low liquidity, easing tensions weigh on demandGold price (XAU/USD) attracts some sellers to around $4,860 during the early Asian trading hours on Wednesday. The precious metal falls amid thin holiday trading, with much of Asia closed for the Lunar New Year.
    Author  FXStreet
    Feb 18, Wed
    Gold price (XAU/USD) attracts some sellers to around $4,860 during the early Asian trading hours on Wednesday. The precious metal falls amid thin holiday trading, with much of Asia closed for the Lunar New Year.
    placeholder
    Gold weakens as USD uptick and risk-on mood dominate ahead of FOMC MinutesGold (XAU/USD) attracts some follow-through selling for the second straight day and slides to the $4,922 area during the Asian session on Tuesday amid thin liquidity on the back of the Lunar New Year holidays in China.
    Author  FXStreet
    Feb 17, Tue
    Gold (XAU/USD) attracts some follow-through selling for the second straight day and slides to the $4,922 area during the Asian session on Tuesday amid thin liquidity on the back of the Lunar New Year holidays in China.
    placeholder
    Gold declines as trading volumes remain subdued due to holidays in ChinaGold price (XAU/USD) extends its losses for the second successive session, trading around $4,930 per troy ounce during the Asian hours on Tuesday.
    Author  FXStreet
    Feb 17, Tue
    Gold price (XAU/USD) extends its losses for the second successive session, trading around $4,930 per troy ounce during the Asian hours on Tuesday.

    Gold Related Articles

    • How and Where to Buy Gold in Australia? A Complete Guide for Beginners
    • Is Mitrade Right for You? A Complete Guide on How to Start Trading CFDs in 5 Steps
    • Gold vs Bitcoin 2026: Which Is the Better Investment?Best Hedge Asset Comparison
    • What is Gold CFD? How to Trade Gold CFD With Mitrade Example
    • 7 Best Gold Trading Platforms in Australia (2026): Top ASIC-Regulated Brokers Compared
    • XAU/USD Gold Price Trend Analysis 2026: Will It Keep Rising?

    Click to view more