


Gold price clings to $2,400 amid risk-aversion and high US yields


■ Gold touches $2,432, then stabilizes near $2,400, pressured by US 10-year yields at 4.274%.
■ FedWatch Tool forecasts 100% chance of a 25 bps rate cut in September, bolstering gold.
■ India slashes import tax on precious metals, spurring demand; key US GDP, PCE data due Thursday.
Gold price is virtually unchanged late in the North American session, set to end the day around familiar levels of $2,400 after hitting a daily high of $2,432.
Risk-aversion and rising US Treasury bond yields seem to have capped the non-yielding metal rally, which usually retreats as investors flock to US Treasuries.
Bullion traders lifted spot prices while US Treasury bond yields edged lower ahead of a US five-year note sale auction. Afterward, the US 10-year Treasury note coupon rose two basis points to 4.274%, a headwind for the golden metal. Meanwhile, the buck remains on the back foot, yet losses are trimmed as measured by the US Dollar Index (DXY). The DXY edges down 0.08% at 104.38.
Risk-off mood helped Gold buyers lift spot prices to a three-day peak, as traders had fully priced in a 25-basis point (bps) rate cut by the Federal Reserve at the upcoming September meeting.
The CME FedWatch Tool shows odds of a quarter of a percentage point cut at 100%, while data from the Chicago Board of Trade (CBOT) sees market participants estimate 53 bps of easing for 2024, via data of the December 2024 fed futures rate contract.
Data-wise the US economic docket revealed the Goods Trade Balance for July printed a narrower deficit than expected. Meanwhile, business activity as measured by the Purchasing Managers Index (PMI) report revealed by S&P was mixed, with manufacturing contracting for the first time since first time since December 2023.
Precious metals were also boosted by India’s decision to cut import taxes from 15% to 6%.
Traders brace for the release of the first reading of the Gross Domestic Product (GDP) for Q2 2024 in the United States (US) on Thursday. This would be followed by the release of the Fed’s preferred gauge for inflation, the Personal Consumption Expenditure (PCE) Price Index figures for June.
Daily digest market movers: Gold price remains glued to the $2,400 figure
S&P Global revealed that Services and Composite PMIs for July exceeded estimates, coming at 56 and 55, with the former exceeding expectations of 55.
The S&P Global Manufacturing PMI dropped from 51.6 to 49.5, missing the consensus of 51.7.
The US Goods Trade Balance Advanced for June came at $-96.0 billion, below the $-98.0 billion and less than May’s $-99.4 billion.
The Gross Domestic Product (GDP) for Q2 is projected to rise from 1.4% in Q1 2024 to 1.9% quarter-over-quarter (QoQ), indicating that the economy is accelerating as the year progresses.
The Fed’s preferred measure of inflation, the Core PCE, is expected to dip from 2.6% to 2.5% year-over-year (YoY).
Technical analysis: Gold price falls below Tuesday’s high
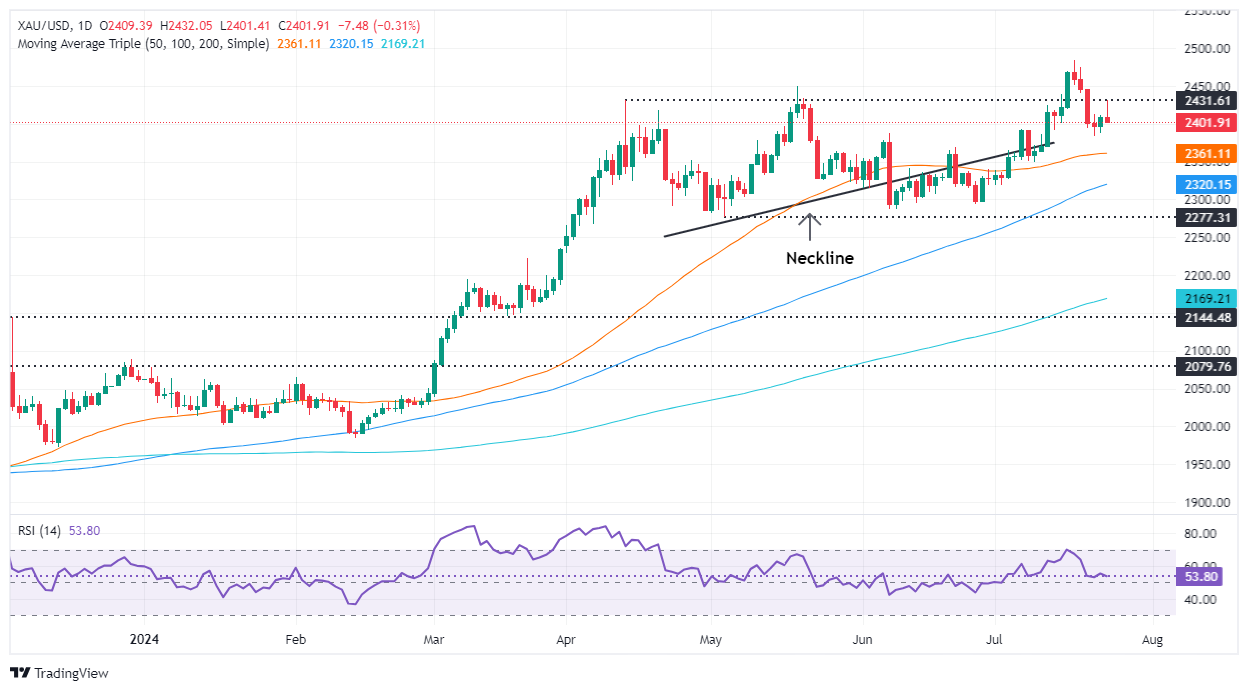
After forming a ‘bullish haram,’ Gold prices hit a three-day peak above $2,430 but have retreated below the July 23 high of $2,412, hinting at buyers' lack of strength. A daily close below the latter could expose XAU/USD to further selling pressure, though US data would drive price action on Thursday and Friday.
The Relative Strength Index (RSI) is bullish, although the slope has turned flat, indicating buyers' and sellers' lack of direction and commitment.
XAU/USD needs to clear Wednesday’s peak at $2,430 for a bullish continuation. Once surpassed, the next resistance would be $2,450 before challenging the all-time high of $2,483. Up next would be the $2,500 figure.
Conversely, if XAU/USD tumbles below the July 22 low of $2,384, a deeper correction is on the cards. The next support would be the 50-day Simple Moving Average (SMA) at $2,359. Once sellers clear the 100-day SMA at $2,315, further losses are seen before falling toward $2,300.
Read more
* The content presented above, whether from a third party or not, is considered as general advice only. This article should not be construed as containing investment advice, investment recommendations, an offer of or solicitation for any transactions in financial instruments.


