


Ripple Price Forecast: XRP bulls defend $1.20 as sell-side pressure triggers liquidations
- XRP holds support in the $1.20-$1.25 range, following a sharp sell-off triggered by Binance’s $6.3 billion hack.
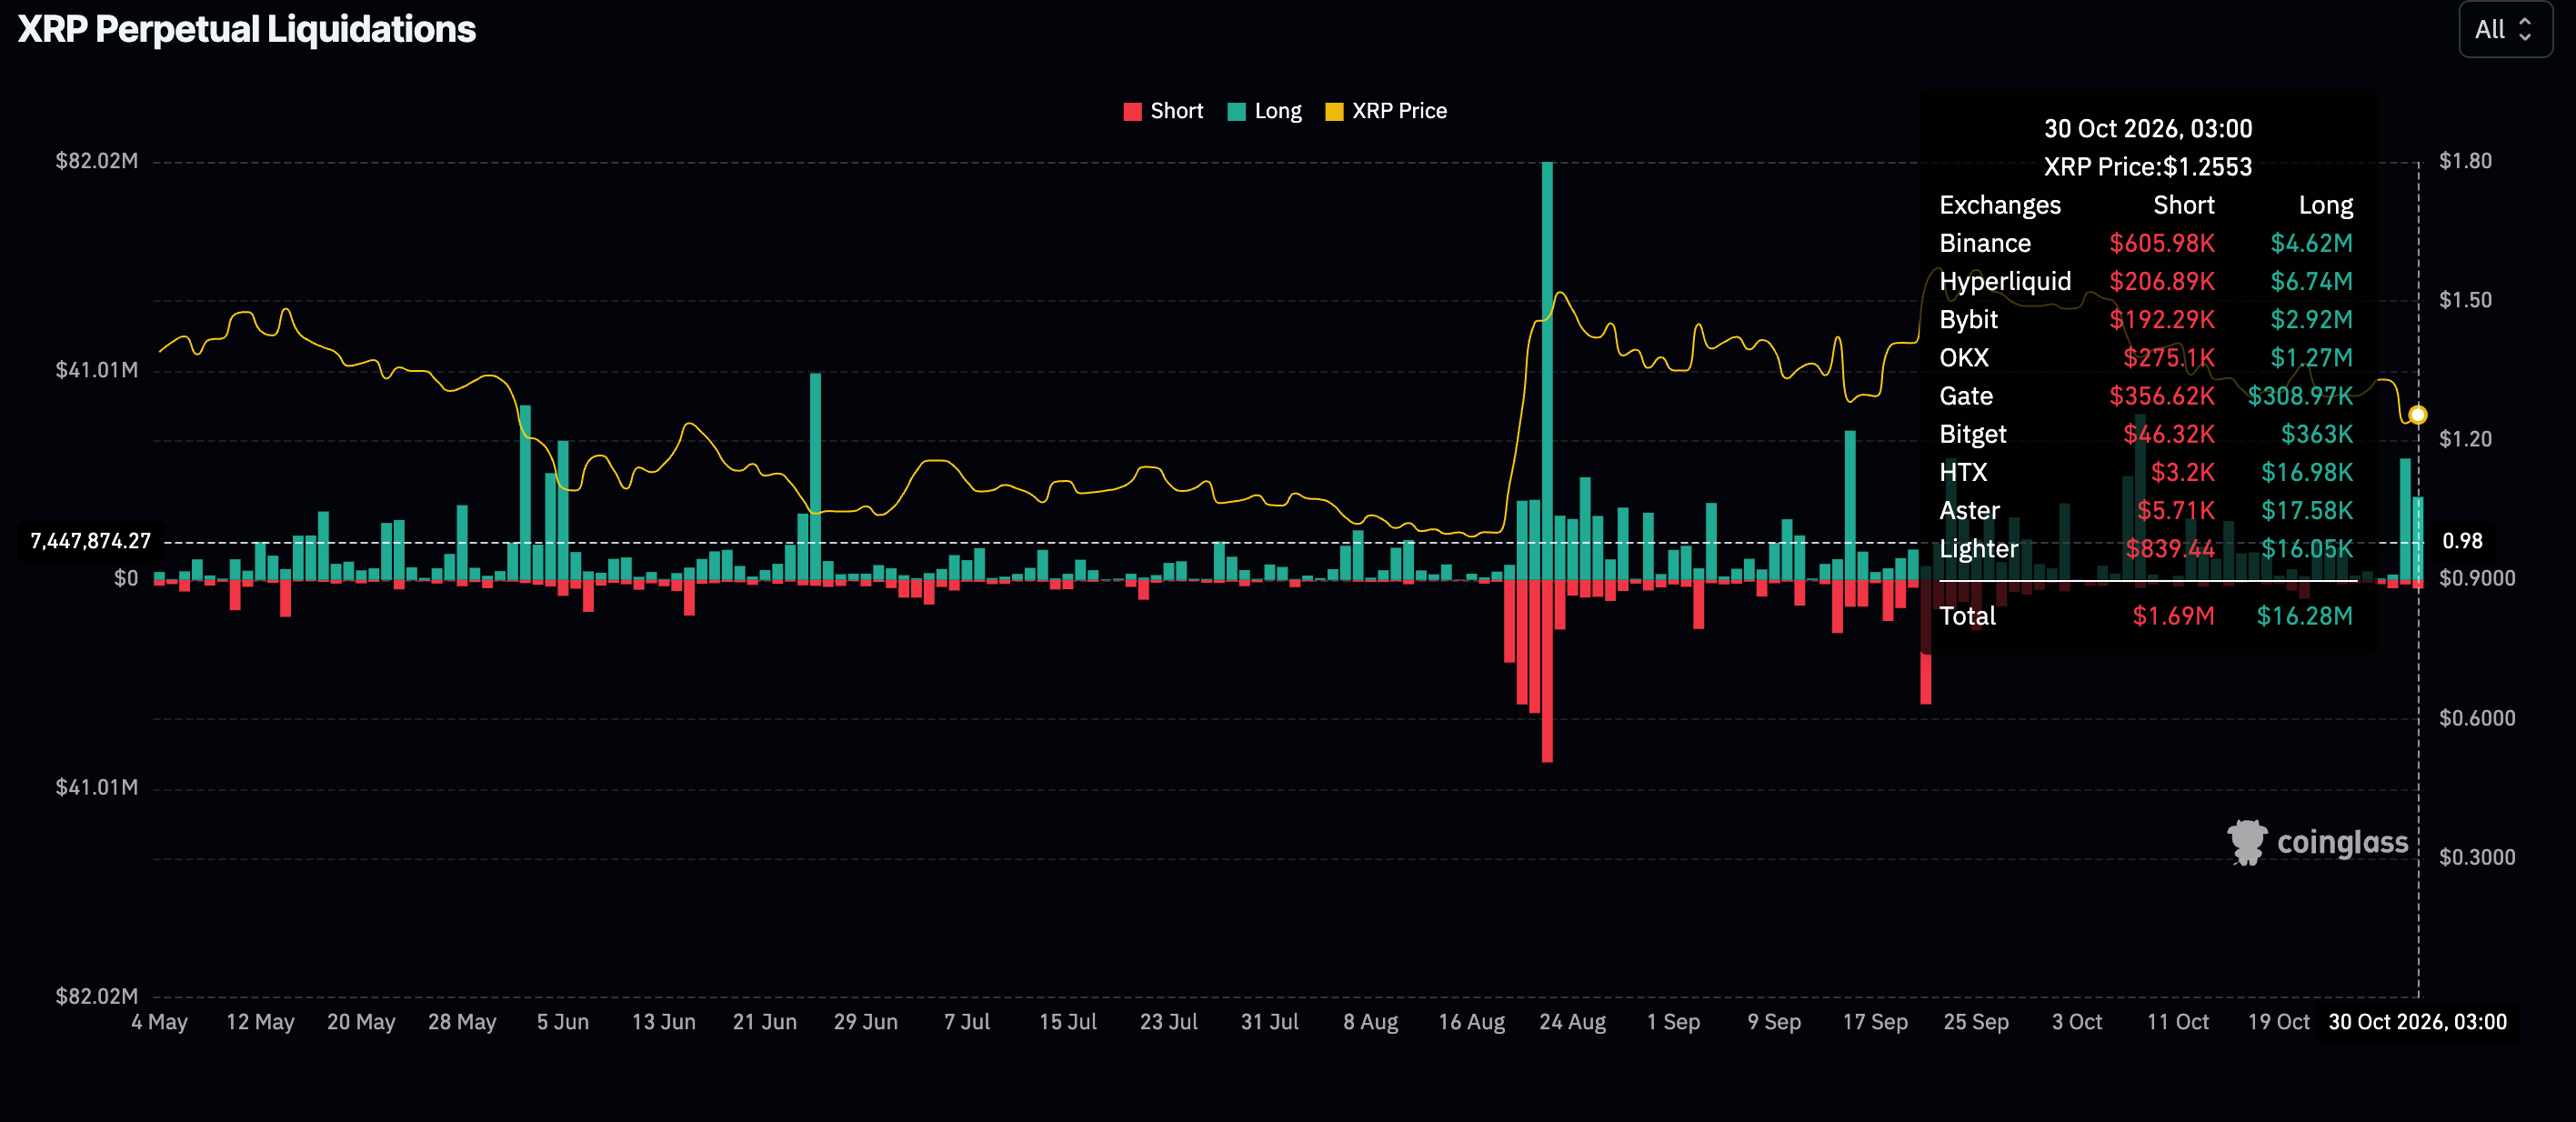
- XRP faces broader selling pressure, with long position liquidations amounting to $16 million on Friday.
- XRP shows signs of recovery, but a dominant bearish structure weighs on price action.
Ripple (XRP) trades around $1.25 on Friday, rising from a short-term support level established at $1.20. This minor upward correction follows a sharp sell-off, triggered amid reports of a hack attack on the Binance exchange that impacted approximately $6.3 billion.
The attack drove the broader crypto market on edge, as Binance suspended both deposits and withdrawals to contain the situation. Updates on X say Binance, along with blockchain partners and law enforcement, has frozen roughly $3 billion as recovery efforts continue.
“Our initial investigation suggested that the security incident may have involved a compromised laptop, however our subsequent investigation has uncovered additional points of breach,” Binance said via X, adding, “This was a complex attack, and we are doing all we can in coordination with law enforcement to resolve it.”
XRP liquidations surge
The sell-off in the broader cryptocurrency market did not spare XRP, which plunged 8% on Thursday, leaving many traders counting losses. CoinGlass data shows nearly $24 million in long position liquidations that day, while short position holders lost only $892,000.
Although the sell-off cooled on Friday, long position liquidations remain elevated at $16 million, while approximately $1.7 million in short positions were wiped out. Bullish traders will likely bear the biggest brunt of the correction if support at $1.20 weakens and paves the way for deeper losses. However, if the ongoing recovery maintains the momentum, tables could turn. Either way, it is too early to tell, and watching how the price behaves in the coming days will provide a clearer path.
Technical analysis: XRP holds key lower support level
XRP trades near $1.25 after a minor upward correction from support recently tested at $1.20. Similarly, the token maintains a clear bearish near-term tone as price holds below all key Exponential Moving Averages (EMAs) and the prevailing SuperTrend line. The 100-day EMA at $1.33, the 50-day EMA at $1.35 and the 200-day EMA at $1.37 all sit overhead, suggesting the pair remains capped after its recent slide from the mid-$1.30s.
The SuperTrend indicator at $1.41 reinforces the broader topside pressure, while the Relative Strength Index (RSI) around 36 hints at lingering downside momentum. Moving Average Convergence Divergence (MACD) is marginally negative and below zero, suggesting selling pressure remains dominant, even if short-term downside may be moderating.
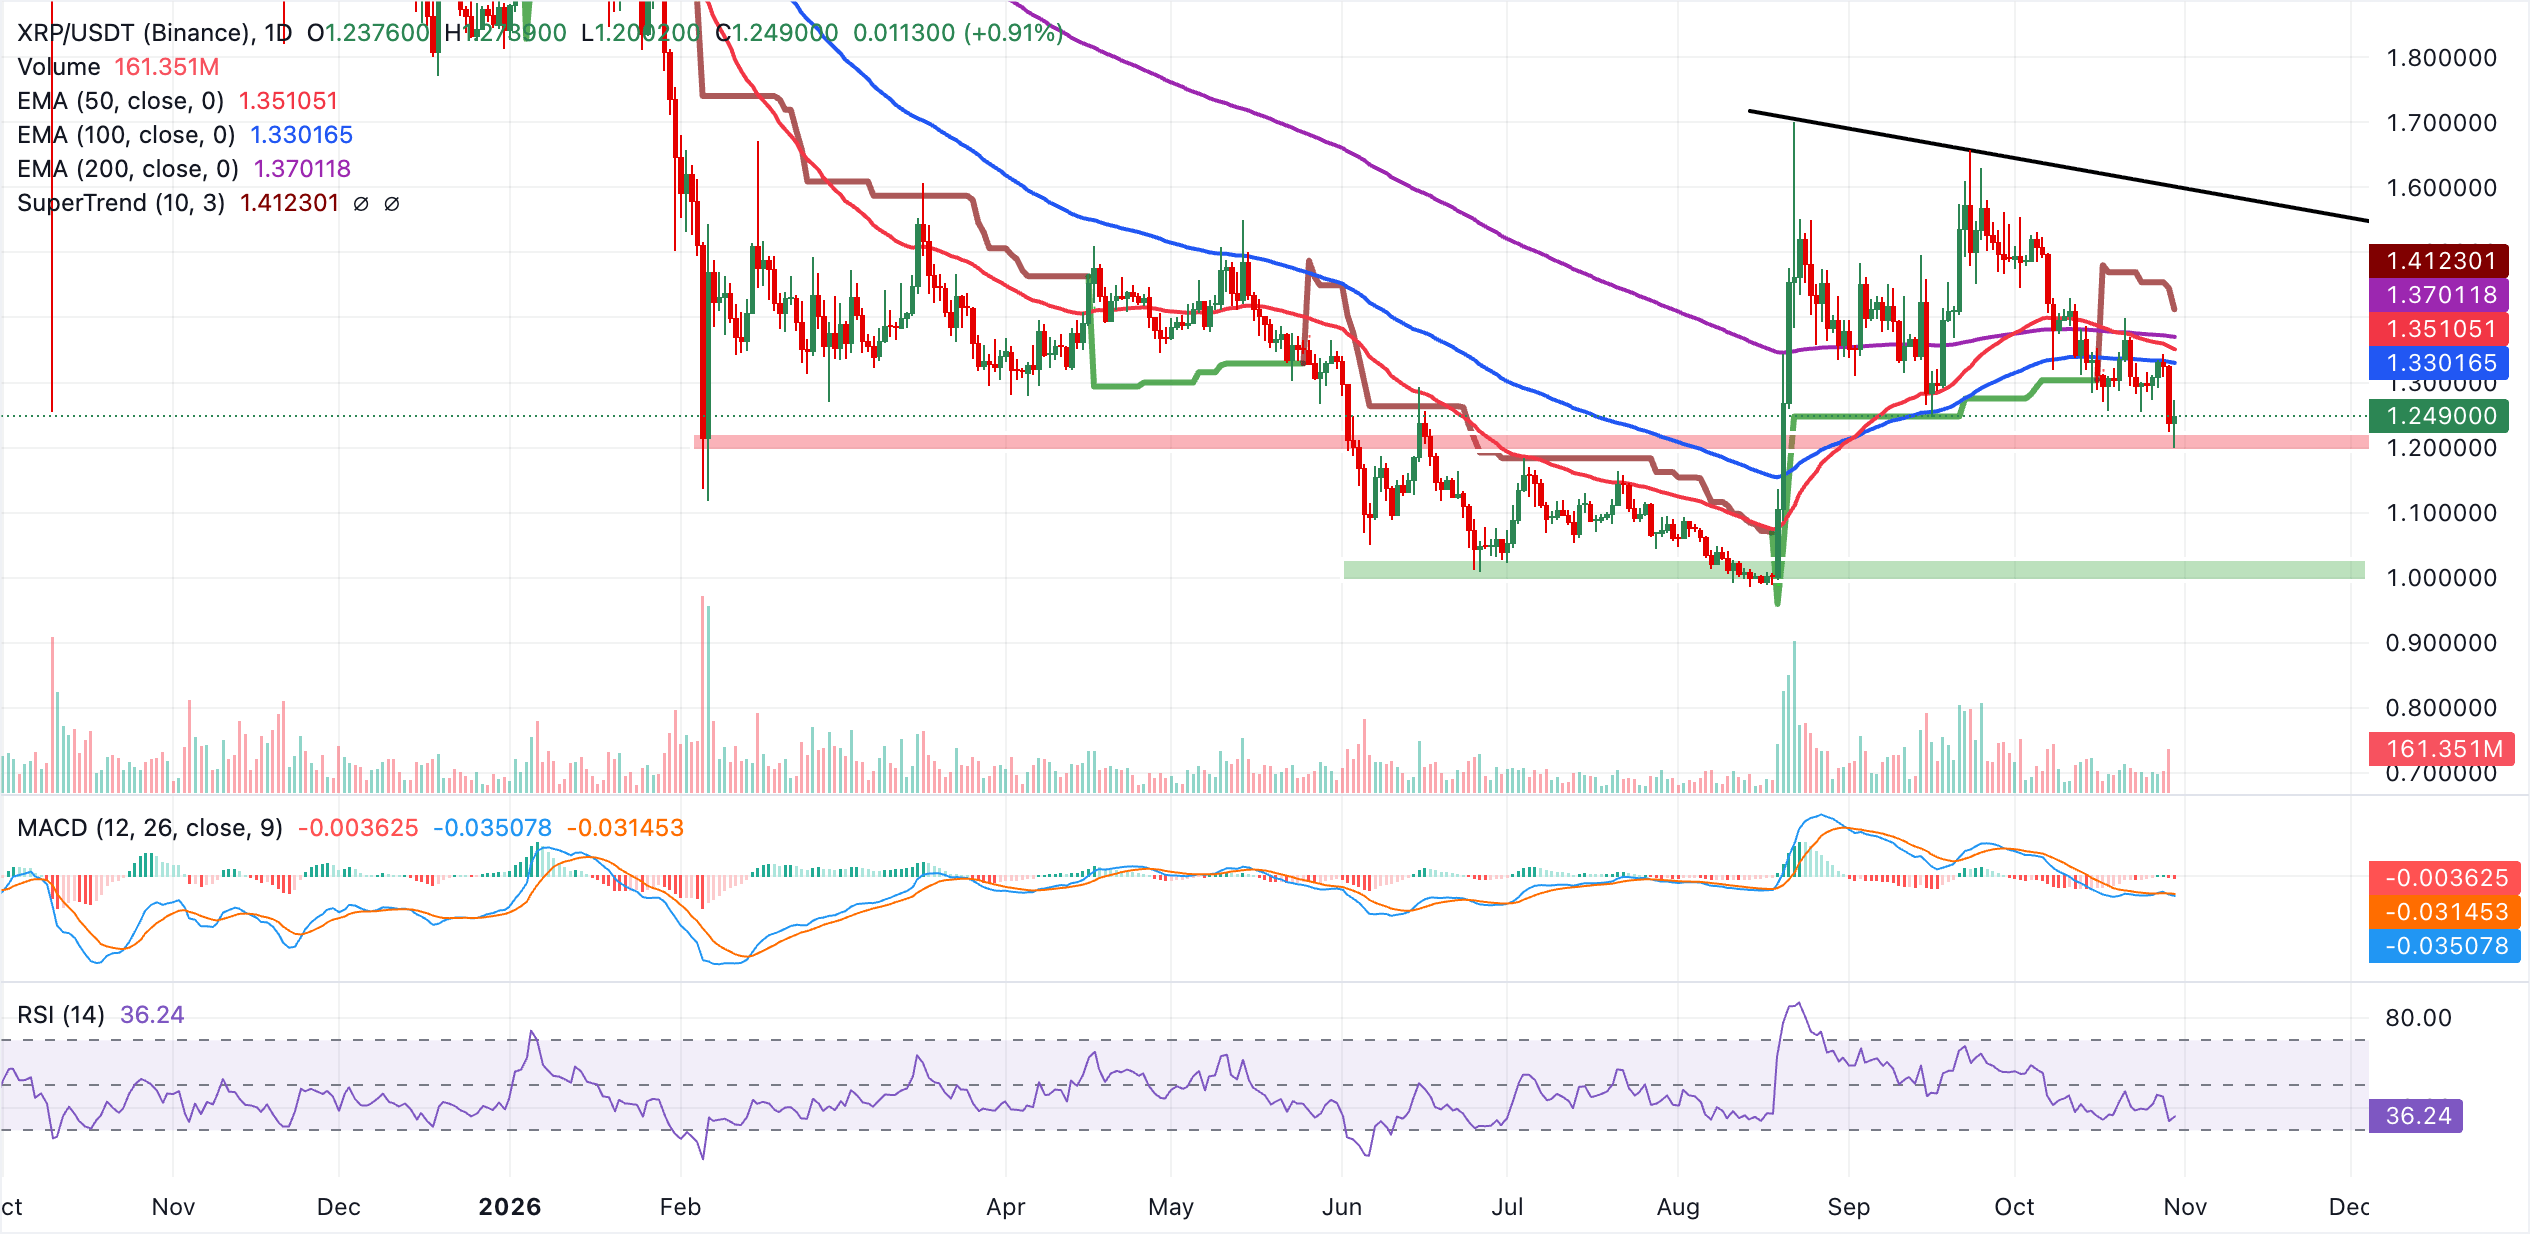
Immediate resistance lies at the 100-day EMA at $1.33, followed by the 50-day EMA at $1.35 and the 200-day EMA at $1.37, forming a dense supply zone that would need to be reclaimed to ease the bearish bias. Above these, the SuperTrend line at $1.41 is the next hurdle, ahead of broader downtrend resistance near $1.60.
With no nearby structural support defined by the current indicator set on the daily chart, the pair remains vulnerable to further downside until buyers can push XRP back above the clustered moving averages.
(The technical analysis of this story was written with the help of an AI tool. Know more.)
Ripple FAQs
Ripple is a payments company that specializes in cross-border remittance. The company does this by leveraging blockchain technology. RippleNet is a network used for payments transfer created by Ripple Labs Inc. and is open to financial institutions worldwide. The company also leverages the XRP token.
XRP is the native token of the decentralized blockchain XRPLedger. The token is used by Ripple Labs to facilitate transactions on the XRPLedger, helping financial institutions transfer value in a borderless manner. XRP therefore facilitates trustless and instant payments on the XRPLedger chain, helping financial firms save on the cost of transacting worldwide.
XRPLedger is based on a distributed ledger technology and the blockchain using XRP to power transactions. The ledger is different from other blockchains as it has a built-in inflammatory protocol that helps fight spam and distributed denial-of-service (DDOS) attacks. The XRPL is maintained by a peer-to-peer network known as the global XRP Ledger community.
XRP uses the interledger standard. This is a blockchain protocol that aids payments across different networks. For instance, XRP’s blockchain can connect the ledgers of two or more banks. This effectively removes intermediaries and the need for centralization in the system. XRP acts as the native token of the XRPLedger blockchain engineered by Jed McCaleb, Arthur Britto and David Schwartz.
Recommended Articles


