


Gold Price Analysis Today | Forex Gold Analysis | XAU/USD Analysis - October 30, 2026


Today's Gold Price
Gold price chart for today
*0% Commission and Low Spreads 0️⃣
*$50,000 in Free Virtual Funds 💰
*$100 New Customer Bonus 🎁
Gold (XAU/USD) pulled back to test psychological support near $4,004 this morning (October 30, 2026), coming under heavy pressure after U.S. third-quarter GDP grew a robust 3.4% and Core PCE inflation accelerated to 2.5%. Initial jobless claims also remained below 200,000 for a sixth straight week, reinforcing expectations that the Fed will maintain a restrictive stance through December. Today's key question is whether the critical $3,980–4,000 support zone can withstand the pressure.
Today's Key Points
| Key Takeaways |
|
|
|
U.S. Third-Quarter GDP Surges 3.4% as Core Inflation Accelerates, Leading Markets to Price in a Year-End Fed Rate Hike
The U.S. Bureau of Economic Analysis (BEA) reported that third-quarter GDP expanded 3.4%, above expectations of 3.2% and accelerating from 2.2% in the second quarter. The gain was supported by a 3.8% jump in consumption and business investment, showing that the economy remains resilient in the face of high borrowing costs.
Third-quarter Core PCE inflation rose 2.5%, above expectations of 2.4%, while the annual headline inflation rate accelerated to 3.6%. This led markets to increase bets on a 25-basis-point Fed rate hike in December after two officials dissented at the latest FOMC decision, pushing up the opportunity cost of holding gold and pressuring it down to $4,024.60.
Labor Market Stronger Than Expected as Jobless Claims Remain Below 200,000 for Longest Stretch Since Early 2023
The U.S. Labor Department said initial jobless claims fell to 194,000, better than expectations of 198,000. Claims have remained below 200,000 for six straight weeks, the longest stretch since January 2023, signaling that the labor market remains highly stable.
The four-week average fell to 196,750, while continuing claims declined to 1.701 million, indicating that unemployed workers are returning to work quickly. The data give the Fed room to maintain a restrictive monetary-policy stance, leaving gold under continued selling pressure as it nears a test of the $4,000 zone.
U.S.-Iran Diplomacy Eases Oil Prices and Curbs Safe-Haven Demand Despite Heavy Selloff in Technology Stocks
Tensions in the Middle East eased temporarily after reports that Vice President JD Vance sent a message to Iran's Supreme National Security Council to negotiate, while Qatar submitted a draft agreement to end the conflict. This helped ease concerns around the Strait of Hormuz and pressured oil prices lower, although Iran rejected the draft.
However, selling in technology stocks and a pullback in bond yields did not support buying in gold. Jamie Cox of Harris Financial Group said hyperscalers' need to raise funds for AI investment was draining liquidity, leading investors to favor the dollar over gold.



Technical Analysis of Gold (XAU/USD)
On the one-hour chart, gold has broken below its $4,035–4,060 consolidation range to test psychological support and the key $3,980–4,000 base. Candles are beginning to show buying that is absorbing liquidity and helping to support prices, but no clear reversal candle has emerged, leaving the broader structure in a short-term correction.
The RSI (14) has slowed into the 35–40 zone, showing that buying momentum has weakened significantly and is approaching oversold territory. However, as it remains below 50, any rebound is still only a technical rebound until higher lows are formed.
The key test is a reclaim and close above the initial $4,032–4,044 resistance zone to confirm base-building. Until then, beware of a bull trap that could allow selling pressure to push prices back down to retest the lower base.
If prices hold above $3,980–4,000 and clear $4,032–4,044, a recovery could extend toward $4,074–4,083 and $4,101–4,115. A break below $3,980, however, would open the risk of a decline toward $3,932–3,951 and then $3,829–3,849.
Today's Gold Price Outlook
| Scenarios |
|
|
|
Today's Trading Strategy
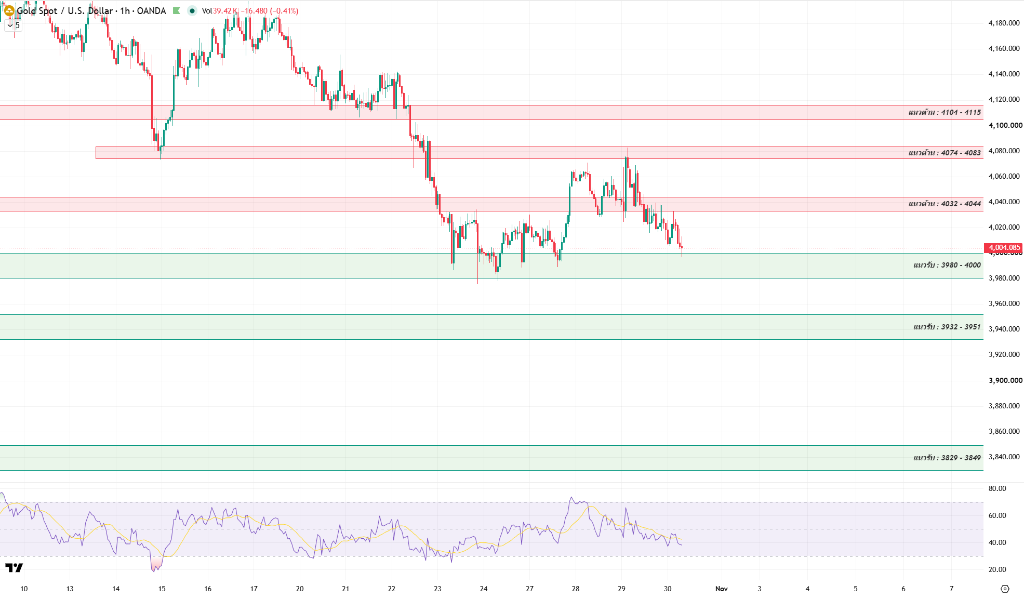
Short-term traders should trade the range cautiously. Wait for signs that selling is being absorbed near the $4,000 psychological support before opening positions, avoid chasing prices until they clear the first resistance zone, and always use a stop-loss.
- Buy setup: Look for a pullback to $3,980–4,000 support with clear buying support and a reversal candle, or follow a break above $4,044. Profit targets are around $4,074–4,083, with a stop-loss below $3,975.
- Sell setup: Consider short positions if prices rebound to $4,032–4,044 or $4,074–4,083 resistance and meet price rejection, or if they fall below $3,980. Targets are around $3,932–3,951, with a stop-loss above resistance.
For long-term investors, structural support from geopolitical risk and the U.S. debt burden remains in place. Consider accumulating on pullbacks to the $3,932–3,951 or $3,829–3,849 support bases.
Daily Support and Resistance Levels
| Type | Price Level |
| Support #1 | $3,980–4,000 |
| Support #2 | $3,932–3,951 |
| Support #3 | $3,829–3,849 |
| Resistance #1 | $4,032–4,044 |
| Resistance #2 | $4,074–4,083 |
| Resistance #3 | $4,101–4,115 |
Today's Questions (FAQ)
Why Did U.S. Third-Quarter GDP Growth of 3.4% Pressure Gold Down to $4,000?
GDP growth of 3.4% and accelerating Core PCE inflation indicate that the U.S. economy remains strong and can withstand high interest rates. Markets therefore see a possibility that the Fed could raise rates in December, increasing the opportunity cost of holding gold and triggering short-term profit-taking.
Why Didn't the Wall Street Technology-Stock Selloff Support Safe-Haven Buying in Gold?
Although technology stocks fell sharply, investors chose to hold dollars supported by high interest rates. Combined with AI developers' demand for liquidity, this tightened funding conditions, so funds did not flow into non-yielding assets such as gold.
Read more
The above content was completed with the assistance of AI and has been reviewed by an editor.


