


BNB (BNBUSD) Is down 1.91% on Oct 30: Here Is Why
BNB (BNBUSD) is down 1.91% at Oct 30 20:25(ET), now at $682.7, with a 7-day down of 7.72%.
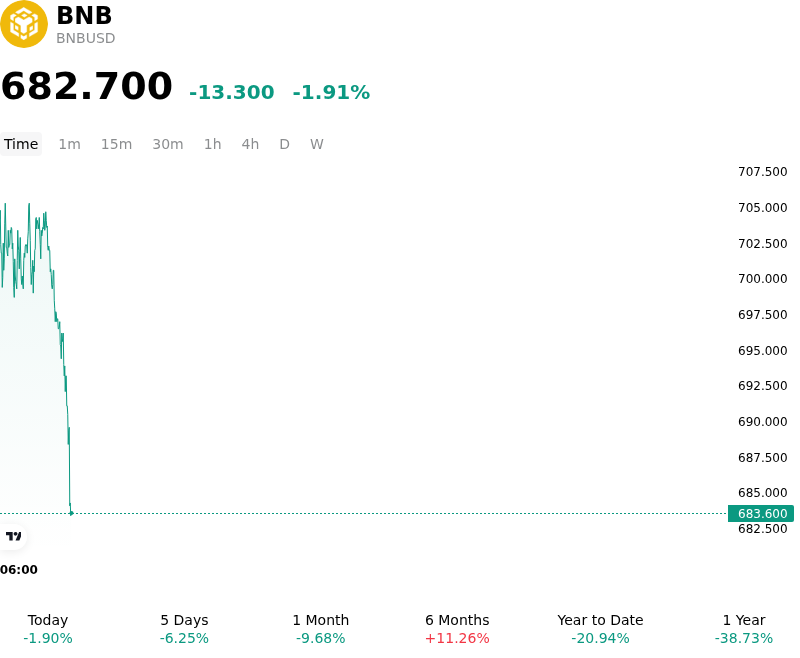
What is driving BNB (BNBUSD)’s stock price down today?
BNB experienced downside pressure primarily driven by heightened headline risk and sentiment repricing surrounding its core exchange ecosystem following security incident reports. Because BNB functions as a direct proxy for Binance exchange performance, operational health, and counterparty confidence, emergent security concerns prompted immediate risk reduction across trading desks. Even when capital outflows directly involve third-party tokens rather than native BNB holdings, market participants frequently trim venue-linked exposure to mitigate potential operational disruptions, potential regulatory oversight, or liquidity friction.
The decline was amplified by restrictive macroeconomic conditions and broader risk-off sentiment dominating digital asset markets. Persistently elevated US Treasury yields and tight central bank liquidity conditions continued to compress risk appetite, raising the opportunity cost of holding non-yielding speculative assets. The broader hawkish monetary policy narrative limited institutional buy-side interest across altcoins, leaving venue tokens exposed to localized negative catalysts without strong macro tailwinds.
From a market structure perspective, derivatives positioning accelerated the intraday slide. A cascade of forced long liquidations on major derivative venues triggered automated delta-hedging by market makers, transmitting downward pressure directly into spot market order books. On-chain fundamentals provided limited counter-momentum, as recent supply-reduction quarterly burns were offset by soft active address growth on BNB Chain. Institutional investors continue to monitor exchange security updates, international regulatory licensing progress, and broader macro liquidity shifts as key determinants for directional stabilization.
Technical Analysis of BNB (BNBUSD)
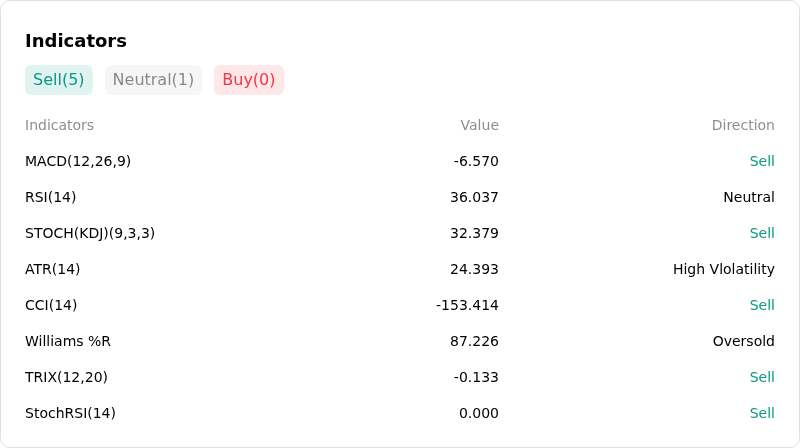
Technically, BNB (BNBUSD) shows a MACD (12,26,9) value of -6.570, indicating a sell signal. The RSI at 36.037 suggests neutral condition and the Williams %R at 87.226 suggests oversold condition. Please monitor closely.
More details about BNB (BNBUSD)
Recent Events and Risks:
- Binance Hot Wallet Security Fears and Heavy Outflow Pressures: Reports of multi-billion-dollar abnormal transfers from Binance-labeled hot wallets sparked intense panic selling across the market, pushing BNB down as much as 9% intraday to a low of $692. Although Binance stated that user funds remain safe while it investigates a potential security issue and major stablecoin issuers froze over $2.3 billion in transferred assets, heightened anxiety surrounding exchange-level security directly impairs spot demand for BNB.
- Cascading Long Liquidations in Derivatives Markets: The rapid price drawdown ignited over $600 million in forced crypto leverage liquidations within an hour, predominantly affecting long positions. High perpetual futures open interest paired with stagnant spot buying leaves BNB highly vulnerable to automated liquidation cascades if price action retests psychological support around $700.
- Declining Active Address Metrics and Fading Spot Demand: Despite the execution of BNB Chain's 37th quarterly token burn, on-chain analytics reveal a 14% drop in average daily active addresses to 2.10 million. Fading user engagement on-chain and whale transfers to exchange deposit addresses indicate growing short-term sell-side pressure and weak organic demand for token burn dynamics to absorb.
- Regulatory Friction and Macro Headwinds: Ongoing international regulatory oversight, strict AML/sanction compliance account freezes, and regional licensing dependencies present a structural drag on Binance's growth. Compounded by elevated U.S. Treasury yields and risk-off crypto sentiment, technical resistance near $750–$760 continues to cap upside recovery and expose BNB to macro-driven sell-offs.
Recommended Articles


