

KOSPI Closes Down Over 3% as SK Hynix and Kioxia Both Plunge 7%, SoftBank Drops Nearly 6%

Source Tradingkey

TradingKey - KOSPI Plunges 5%, Triggering Sidecar Mechanism; SK Hynix and Kioxia Both Collapse 7%.

During the Asian trading session on October 30, Japanese and South Korean stock markets traded lower throughout the day, presenting a broad decline marked by sharp volatility and steep losses in South Korean stocks, alongside pullbacks in Japanese stocks under pressure from high levels. South Korea's KOSPI index plunged over 5% intraday, triggering a sell-side sidecar mechanism. Losses narrowed late in the session as institutional and domestic buyers stepped in, with the index ultimately closing down 3.48% at 5,730.74 points.

The two major heavyweights also strengthened toward the close. Industry leader Samsung Electronics closed down 3.02%, falling below the 230,000 mark to end at 225,000 won; SK Hynix tumbled 7.08% at the close, losing the 1.5 million mark to finish at 1,418,000 won.
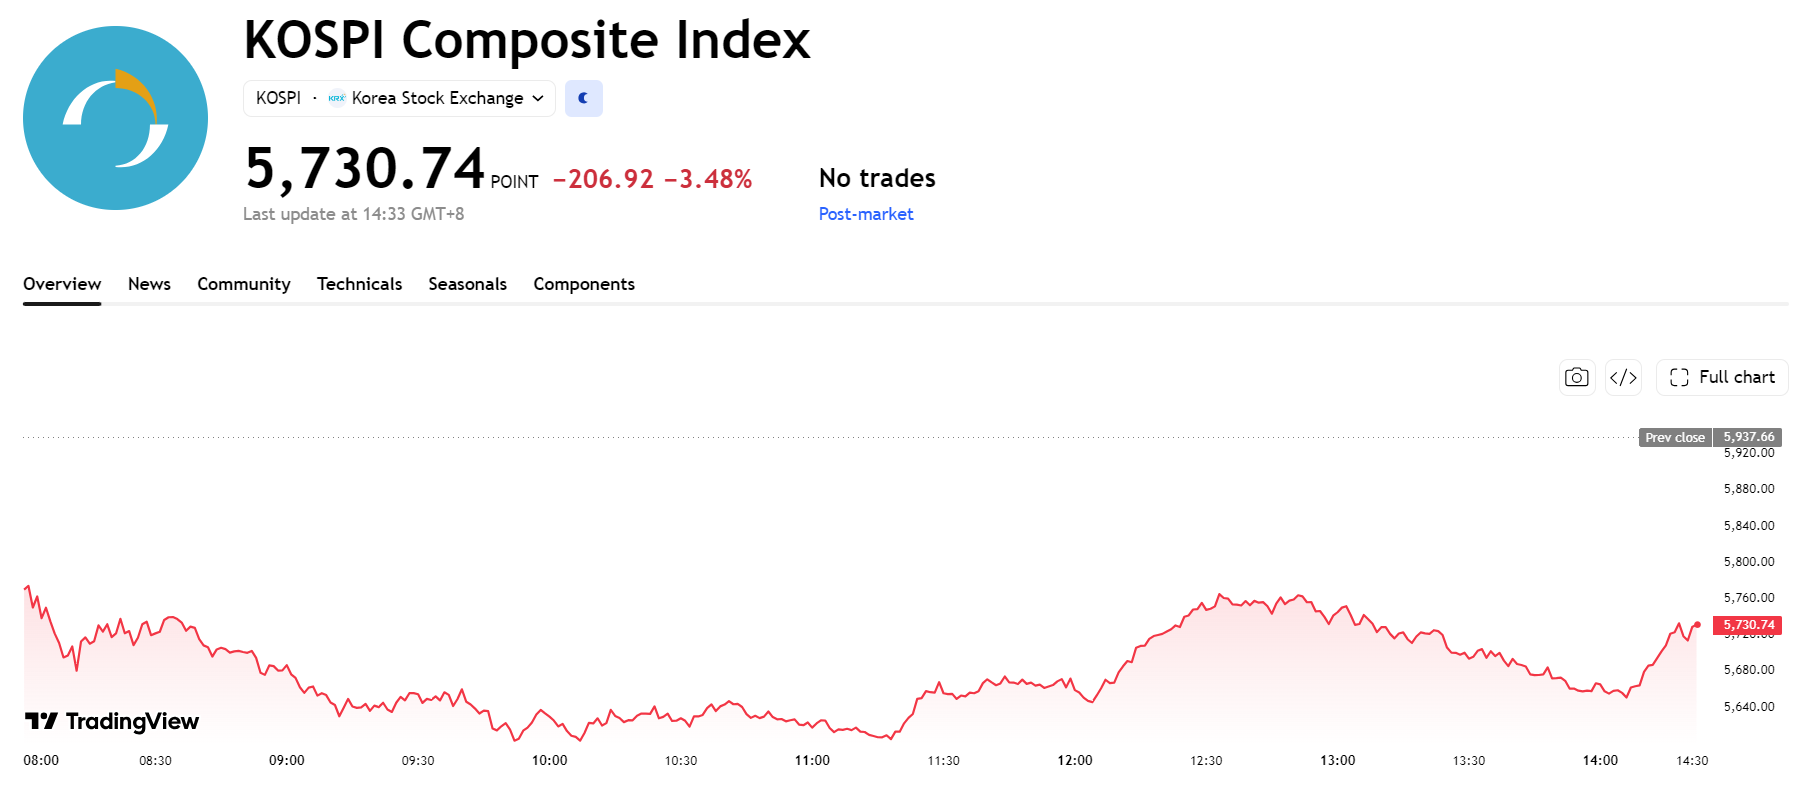
kospi-36d675d4754a4451801158a984f75b6bKOSPI index chart, Source: TradingView

The Nikkei 225 Index ended down 2.12% at 63,289.89 points. Two major heavyweights suffered significant drops, with Kioxia plunging 7.14% to close at 13,470 yen and SoftBank falling 5.96% to close at 4,481 yen.

A series of tech giant earnings reports released in US stocks was the direct trigger for today's bloodbath in Asian semiconductor and AI supply chain stocks. Whether Amazon (AMZN) and Alphabet (GOOG) can stem their decline and rebound at key support levels during regular US trading hours later today will directly determine whether Asian tech stocks can achieve a technical recovery next Monday. If US stocks remain stable and the uncertainty surrounding the November 3 US midterm elections settles, Japanese and South Korean stock markets are expected to shake off the earnings CapEx panic and return to a fundamentals-driven track.

Disclaimer: For information purposes only. Past performance is not indicative of future results.
placeholder
Anthropic files for a $2 trillion IPO — the $80.7 billion loss is the decoy, the $450 billion compute bill is the riskAnthropic publicly filed its S-1 on October 26, revealing $16.29 billion of first-half revenue (+1,304% year over year) and a $80.7 billion net loss — of which $72.4 billion is a non-cash convertible-note charge. The real number is the $450 billion of signed, mostly non-cancelable compute commitments. Here is what the filing says, why NVDA, ARM and MU are the tradeable read-through, and the conditions that decide whether the AI trade passes its first public valuation test.
Author  Irene Q.
Oct 27, Tue
Anthropic publicly filed its S-1 on October 26, revealing $16.29 billion of first-half revenue (+1,304% year over year) and a $80.7 billion net loss — of which $72.4 billion is a non-cash convertible-note charge. The real number is the $450 billion of signed, mostly non-cancelable compute commitments. Here is what the filing says, why NVDA, ARM and MU are the tradeable read-through, and the conditions that decide whether the AI trade passes its first public valuation test.
placeholder
Brent's $115 front month sits $4.6 above January — the $14 spread to WTI is the supply-risk premiumDecember Brent trades at $115.29 while January is $110.71, a $4.58 backwardation. The December Brent-WTI spread is $14.2, versus a $3-5 normal. That gap, not the headline, is where the Middle East supply risk is priced. Here is what the curve says, why the December contract's expiry on October 30 will mechanically cut the headline by $4.6, and the 108.81 neckline that decides the next move.
Author  Irene Q.
Oct 28, Wed
December Brent trades at $115.29 while January is $110.71, a $4.58 backwardation. The December Brent-WTI spread is $14.2, versus a $3-5 normal. That gap, not the headline, is where the Middle East supply risk is priced. Here is what the curve says, why the December contract's expiry on October 30 will mechanically cut the headline by $4.6, and the 108.81 neckline that decides the next move.
placeholder
Gold Price Analysis Today | Forex Gold Analysis | XAU/USD Analysis - October 29, 2026Get the latest gold price analysis, forex gold insights, and XAU/USD analysis for October 29, 2026. Read on for the details.
Author  Mitrade
Yesterday 02: 06
Get the latest gold price analysis, forex gold insights, and XAU/USD analysis for October 29, 2026. Read on for the details.
placeholder
The Fed held at 3.75%–4.00% — and two officials voted to hike. December is now 85% pricedThe FOMC held by a 10–2 vote, with Governor Cook and Cleveland Fed President Hammack dissenting for a 25bp hike. Chair Warsh offered no forward guidance and no dot plot, the 2-year yield fell 8bp to 4.70%, and the dollar slipped to 101.84 even as markets moved December hike odds to 85%–87%. Tonight's Q3 GDP and September core PCE are the next referee.
Author  Irene Q.
Yesterday 02: 55
The FOMC held by a 10–2 vote, with Governor Cook and Cleveland Fed President Hammack dissenting for a 25bp hike. Chair Warsh offered no forward guidance and no dot plot, the 2-year yield fell 8bp to 4.70%, and the dollar slipped to 101.84 even as markets moved December hike odds to 85%–87%. Tonight's Q3 GDP and September core PCE are the next referee.
placeholder
Gold Price Analysis Today | Forex Gold Analysis | XAU/USD Analysis - October 30, 2026Get the latest gold price analysis, forex gold insights, and XAU/USD analysis for October 30, 2026. Read on for the details.
Author  Mitrade
8 hours ago
Get the latest gold price analysis, forex gold insights, and XAU/USD analysis for October 30, 2026. Read on for the details.
goTop
quote