


Gold Price Forecast: Gold Falls Below $4,000 as US September PCE Inflation Accelerates, Risks Drop Toward $3,900
TradingKey - As of the Asian session on Friday, gold prices (XAUUSD) traded near $4,000, briefly falling below $4,000 intraday to a low of $3,986.7, extending losses from the previous session. Earlier on Thursday, gold prices dropped 1.1%, approaching the $4,000 key psychological mark. The latest U.S. September PCE inflation data further showed that price pressures remain elevated, reinforcing market expectations that the Federal Reserve will continue raising interest rates by the end of the year, keeping gold prices under pressure today.
US PCE Inflation Reaccelerates as Fed December Rate Hike Expectations Remain High
Data released by the U.S. Bureau of Economic Analysis on Thursday showed that the overall U.S. PCE price index rose 3.6% year-over-year in September, higher than the 3.4% recorded in August; it increased 0.5% month-over-month, above the previous reading of 0.3%, marking the largest monthly gain in six months. Core PCE, which excludes food and energy, rose 3.1% year-over-year, up from 3.0% in August; it advanced 0.3% month-over-month, matching both the previous value and market expectations.
From the breakdown of the data, rising energy prices were a key factor driving the acceleration in overall inflation. However, the year-over-year increase in core PCE also widened, indicating that underlying inflationary pressures in the U.S. have not eased significantly. Currently, both overall PCE and core PCE remain above the Federal Reserve's 2% long-term inflation target, implying that further controlling inflation remains an important task for monetary policy.
Notably, although the month-over-month PCE data for September was largely in line with expectations, the re-acceleration of year-over-year inflation continues to cap market expectations for a near-term dovish pivot by the Federal Reserve.
The Federal Reserve previously maintained the target range for the federal funds rate unchanged at 3.75%–4.00% at its interest rate meeting on October 28. As the U.S. economy maintains robust growth and inflation continues to run above the target level, the market currently leans toward believing the Fed may hike rates again in December. According to the CME FedWatch Tool, the market-implied probability of a Fed rate hike in December remains at around 74.9%.
Meanwhile, U.S. real GDP grew at an annualized rate of 3.4% in the third quarter, up from 2.2% in the second quarter, demonstrating that the economy retains some resilience. In contrast, personal consumption expenditures rose 0.5% month-over-month in September, down from 0.9% in August, while inflation-adjusted real consumer spending was roughly flat, indicating that consumer growth momentum has slowed.
For gold, elevated inflation combined with resilient economic growth leaves the Federal Reserve with little reason to quickly lower interest rates. Although U.S. Treasury yields have pulled back recently, market expectations for a year-end rate hike remain elevated, limiting the upside for a gold rebound.
If energy prices continue to rise in the future and further add to U.S. inflation pressures, the market may maintain expectations for Federal Reserve monetary tightening, keeping gold prices under downward pressure. Conversely, if future inflation data shows a sustained decline, driving the market to lower rate hike expectations, gold could gain more pronounced momentum for a rally.
Gold Price Technical Analysis
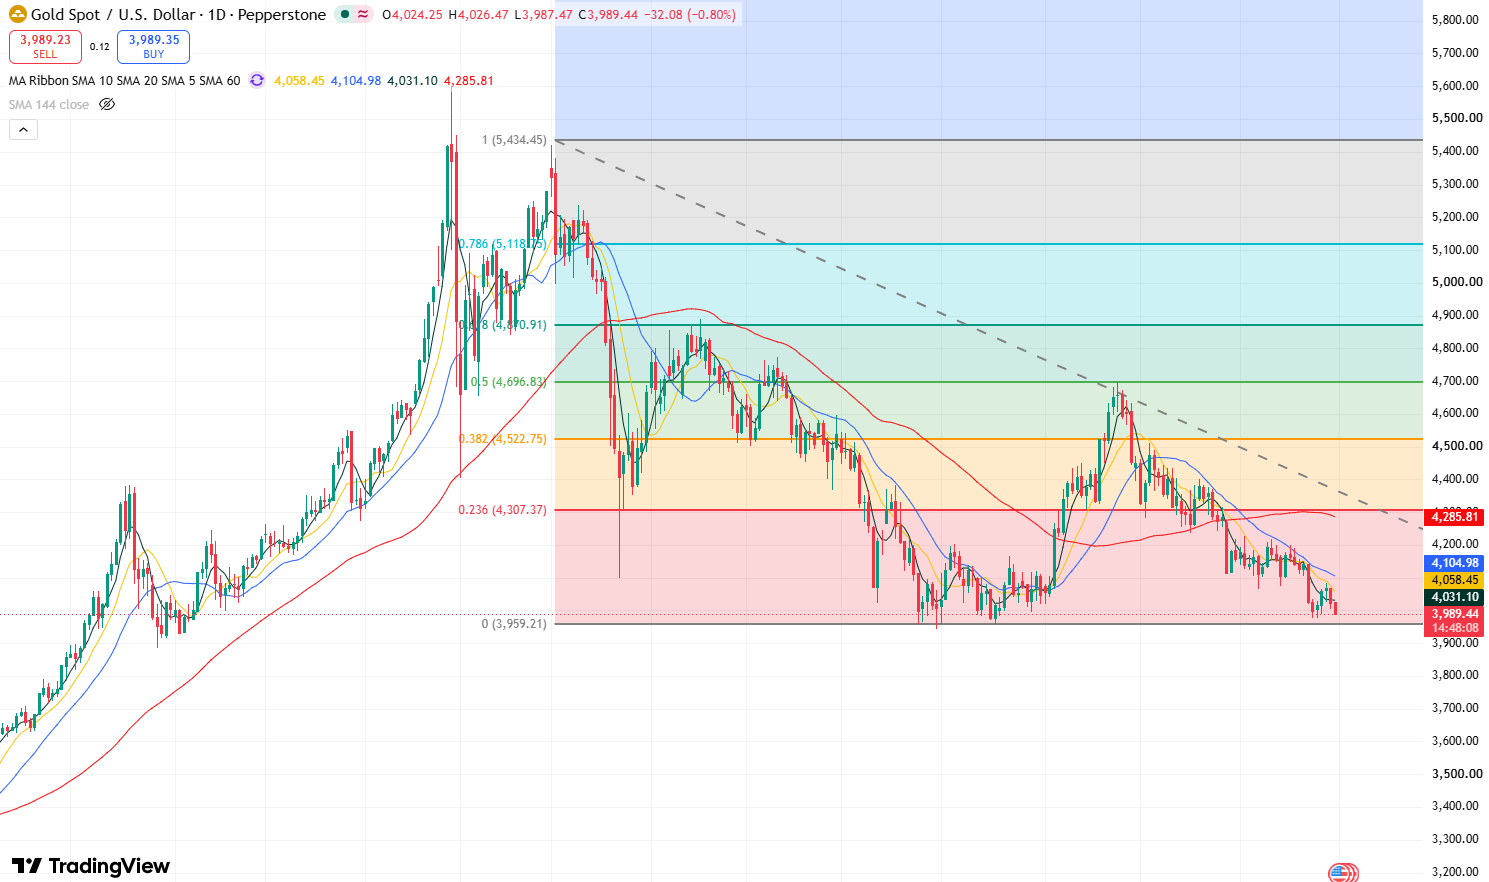
Gold Price Daily Chart, Source: TradingView
Looking at the daily chart, gold's recent rebound stalled near $4,080 before falling back below $4,050. On Thursday, it slipped further toward $4,000 and broke below $4,000 today, indicating that short-term selling pressure remains heavy.
In terms of technical indicators, the Relative Strength Index (RSI) sits near 35 and the MACD remains bearish, indicating that no clear reversal signal has emerged for the current downtrend.
Currently, gold may extend its decline in the short term. The primary support level on the downside is at $3,980; if broken, gold could fall further toward its year-to-date low near $3,942.50. If that level fails to hold, gold could slide toward the $3,900 mark.
On the upside, if today's gold price closes firmly above $3,980 and manages to stand above $4,000, gold could experience a technical corrective rebound in the short term. The initial target would be testing short-term resistance at $4,080 again, and a breakout above this level could lead to further testing of resistance in the $4,110-$4,140 range.
Recommended Articles


