


Warning: The Stock Market Is Doing Something Last Seen Before the Dot-Com Crash -- and Investors Should Pay Attention
Key Points
JPMorgan Chase sees a similar pattern between some stocks today and before the dot-com crash of 2000.
Citi's Bear Market Checklist is flashing the most warning signs since before the stock market crash of 2008.
Investors shouldn't panic, but they should be cautious.
- These 10 stocks could mint the next wave of millionaires ›
Investors who have been around a while no doubt remember the dot-com bubble and subsequent crash quite well. The S&P 500 (SNPINDEX: ^GSPC) sank as much as 48% between January 2000 and July 2002. The Nasdaq-100 plunged more than 80%. It took years for the indexes to fully recover.
That tumultuous period might seem like ancient history today with the S&P 500 and Nasdaq-100 trading near their all-time highs. But could there be a dangerous undercurrent below the surface? Maybe. The stock market is doing something last seen before the dot-com crash -- and investors should pay attention.
Missed Nvidia in 2009? This Rare Signal Is Flashing Again. In 2009, a "Double Down" signal flashed for a little-known chipmaker called Nvidia. For the first time in years, that same "Total Conviction" signal is flashing for a company 1/100th the size of Nvidia. Continue »

Image source: Getty Images.
A dangerous divergence
Major Wall Street investment firms pay big bucks to analysts to closely monitor market patterns and trends that could easily be overlooked. JPMorgan Chase (NYSE: JPM) is one of them. The big bank's Jason Hunter wrote to investors last week, issuing a stark warning. Hunter identified what he called a "growing divergence" between artificial intelligence (AI) hardware stocks and the stocks of companies investing heavily in AI infrastructure spending.
For example, Micron (NASDAQ: MU) provides memory chips used in AI data centers. The stock has skyrocketed close to 250% year to date. Meanwhile, the so-called "Magnificent Seven" stocks with ginormous AI-related capital expenditures haven't performed nearly as well. Shares of two of the group's biggest AI spenders, Amazon (NASDAQ: AMZN) and Microsoft (NASDAQ: MSFT), have delivered negative returns so far in 2026. Hunter wrote that this price performance gap is "reminiscent of the 1999-2000 dynamic."
Of course, AI wasn't the hot technology it is now back then. However, internet stocks were abuzz. As Hunter observed, a disconnect between internet hardware stocks and the stocks of companies investing in internet hardware emerged before the dot-com bubble burst. The current pattern with AI stocks is eerily similar.
More troubling signs
It could be easy to dismiss one common denominator between the markets of today and those at the turn of the century. However, there are more troubling signs that shouldn't be ignored.
In June, Citi (NYSE: C) Research released its proprietary Bear Market Checklist. This checklist includes 18 market indicators, ranging from credit spreads to stock valuation multiples. Citi's research identified 10 global bear-market warning flags and 11.5 U.S. flags.
The good news is that these numbers were well below the 17.5 flags that flashed before the dot-com crash. However, the number of worrisome market indicators on Citi's Bear Market Checklist is the highest since the 2008 stock market crash.
Stock valuations are an obvious trouble spot. The S&P 500 Shiller CAPE Ratio, which measures the S&P's cyclically adjusted price-to-earnings ratio, is at its highest level since early 2000. Warren Buffett's favorite valuation metric, the ratio of total U.S. stock market capitalization to gross domestic product (GDP), is at a record high of 233.8%. Buffett has stated that when this ratio (known as the Buffett indicator) approaches 200%, investors are "playing with fire."
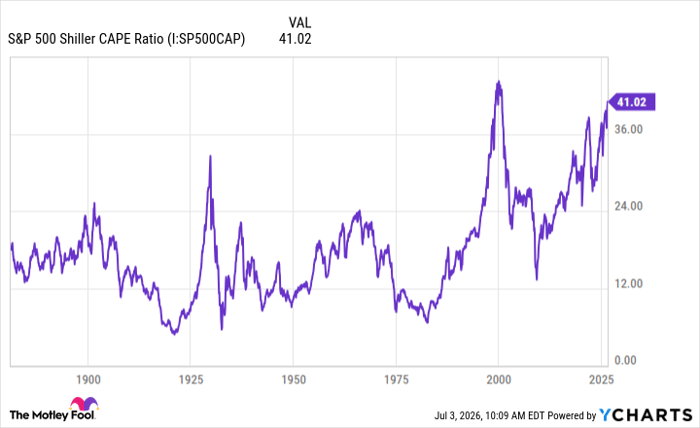
S&P 500 Shiller CAPE Ratio data by YCharts
What should investors do?
Even though JPMorgan sees a worrisome pattern in today's markets that resembles conditions before the dot-com crash, its analysts remain generally optimistic. In the company's 2026 mid-year report, JPMorgan stated, "We entered 2026 tracking three themes -- fragmentation, inflation, and AI -- because we believed they would be the primary drivers of portfolio returns, not only this year but beyond it. We still believe it."
Citi Research seems to be on the same page. Even though its Bear Market Checklist is flashing the most warning signs since 2008, Citi's analysts still predict the stock market will perform relatively well throughout the rest of the year.
Neither Wall Street giant thinks that investors should panic. They're right. Patient investors made money over the long run following the 2000 and 2008 stock market crashes. They can do so again if another crash is imminent.
That said, Citi cautioned in its note to investors last month that once the number of flags on its Bear Market Checklist hits double digits, market conditions can deteriorate quickly. Investors should be highly selective about which stocks they buy and pay especially close attention to valuations. Keeping some cash in reserve to take advantage of a potential market pullback is also prudent. History just might repeat itself.
Where to invest $1,000 right now
When our analyst team has a stock tip, it can pay to listen. After all, Stock Advisor’s total average return is 918%* — a market-crushing outperformance compared to 208% for the S&P 500.
They just revealed what they believe are the 10 best stocks for investors to buy right now, available when you join Stock Advisor.
See the stocks »
*Stock Advisor returns as of July 5, 2026.
Citigroup is an advertising partner of Motley Fool Money. JPMorgan Chase is an advertising partner of Motley Fool Money. Keith Speights has positions in Amazon and Microsoft. The Motley Fool has positions in and recommends Amazon, JPMorgan Chase, Micron Technology, and Microsoft. The Motley Fool has a disclosure policy.
Recommended Articles


