




Dogecoin Price Forecast: DOGE struggles below key moving average resistance
- Dogecoin attempts recovery above $0.0800 amid a broad bearish outlook.
- Retail demand remains subdued with perpetual futures Open Interest at 15 billion DOGE.
- Dogecoin bulls seek to regain trend control as the RSI and MACD show signs of recovery.
Dogecoin (DOGE) is trading marginally above $0.0800 on Tuesday, up 1% on the day, against lows around $0.0785. The meme coin is cautiously navigating a broader lethargic cryptocurrency market where Bitcoin (BTC), Ethereum (ETH) and Ripple (XRP) are struggling to gain momentum.
Despite intraday moves, Dogecoin’s technical structure keeps price action constrained below a key descending trendline and a cluster of overhead moving averages and dynamic indicators, keeping the short-term bias downward.
Fed rate hold bets stay elevated amid moderate retail participation
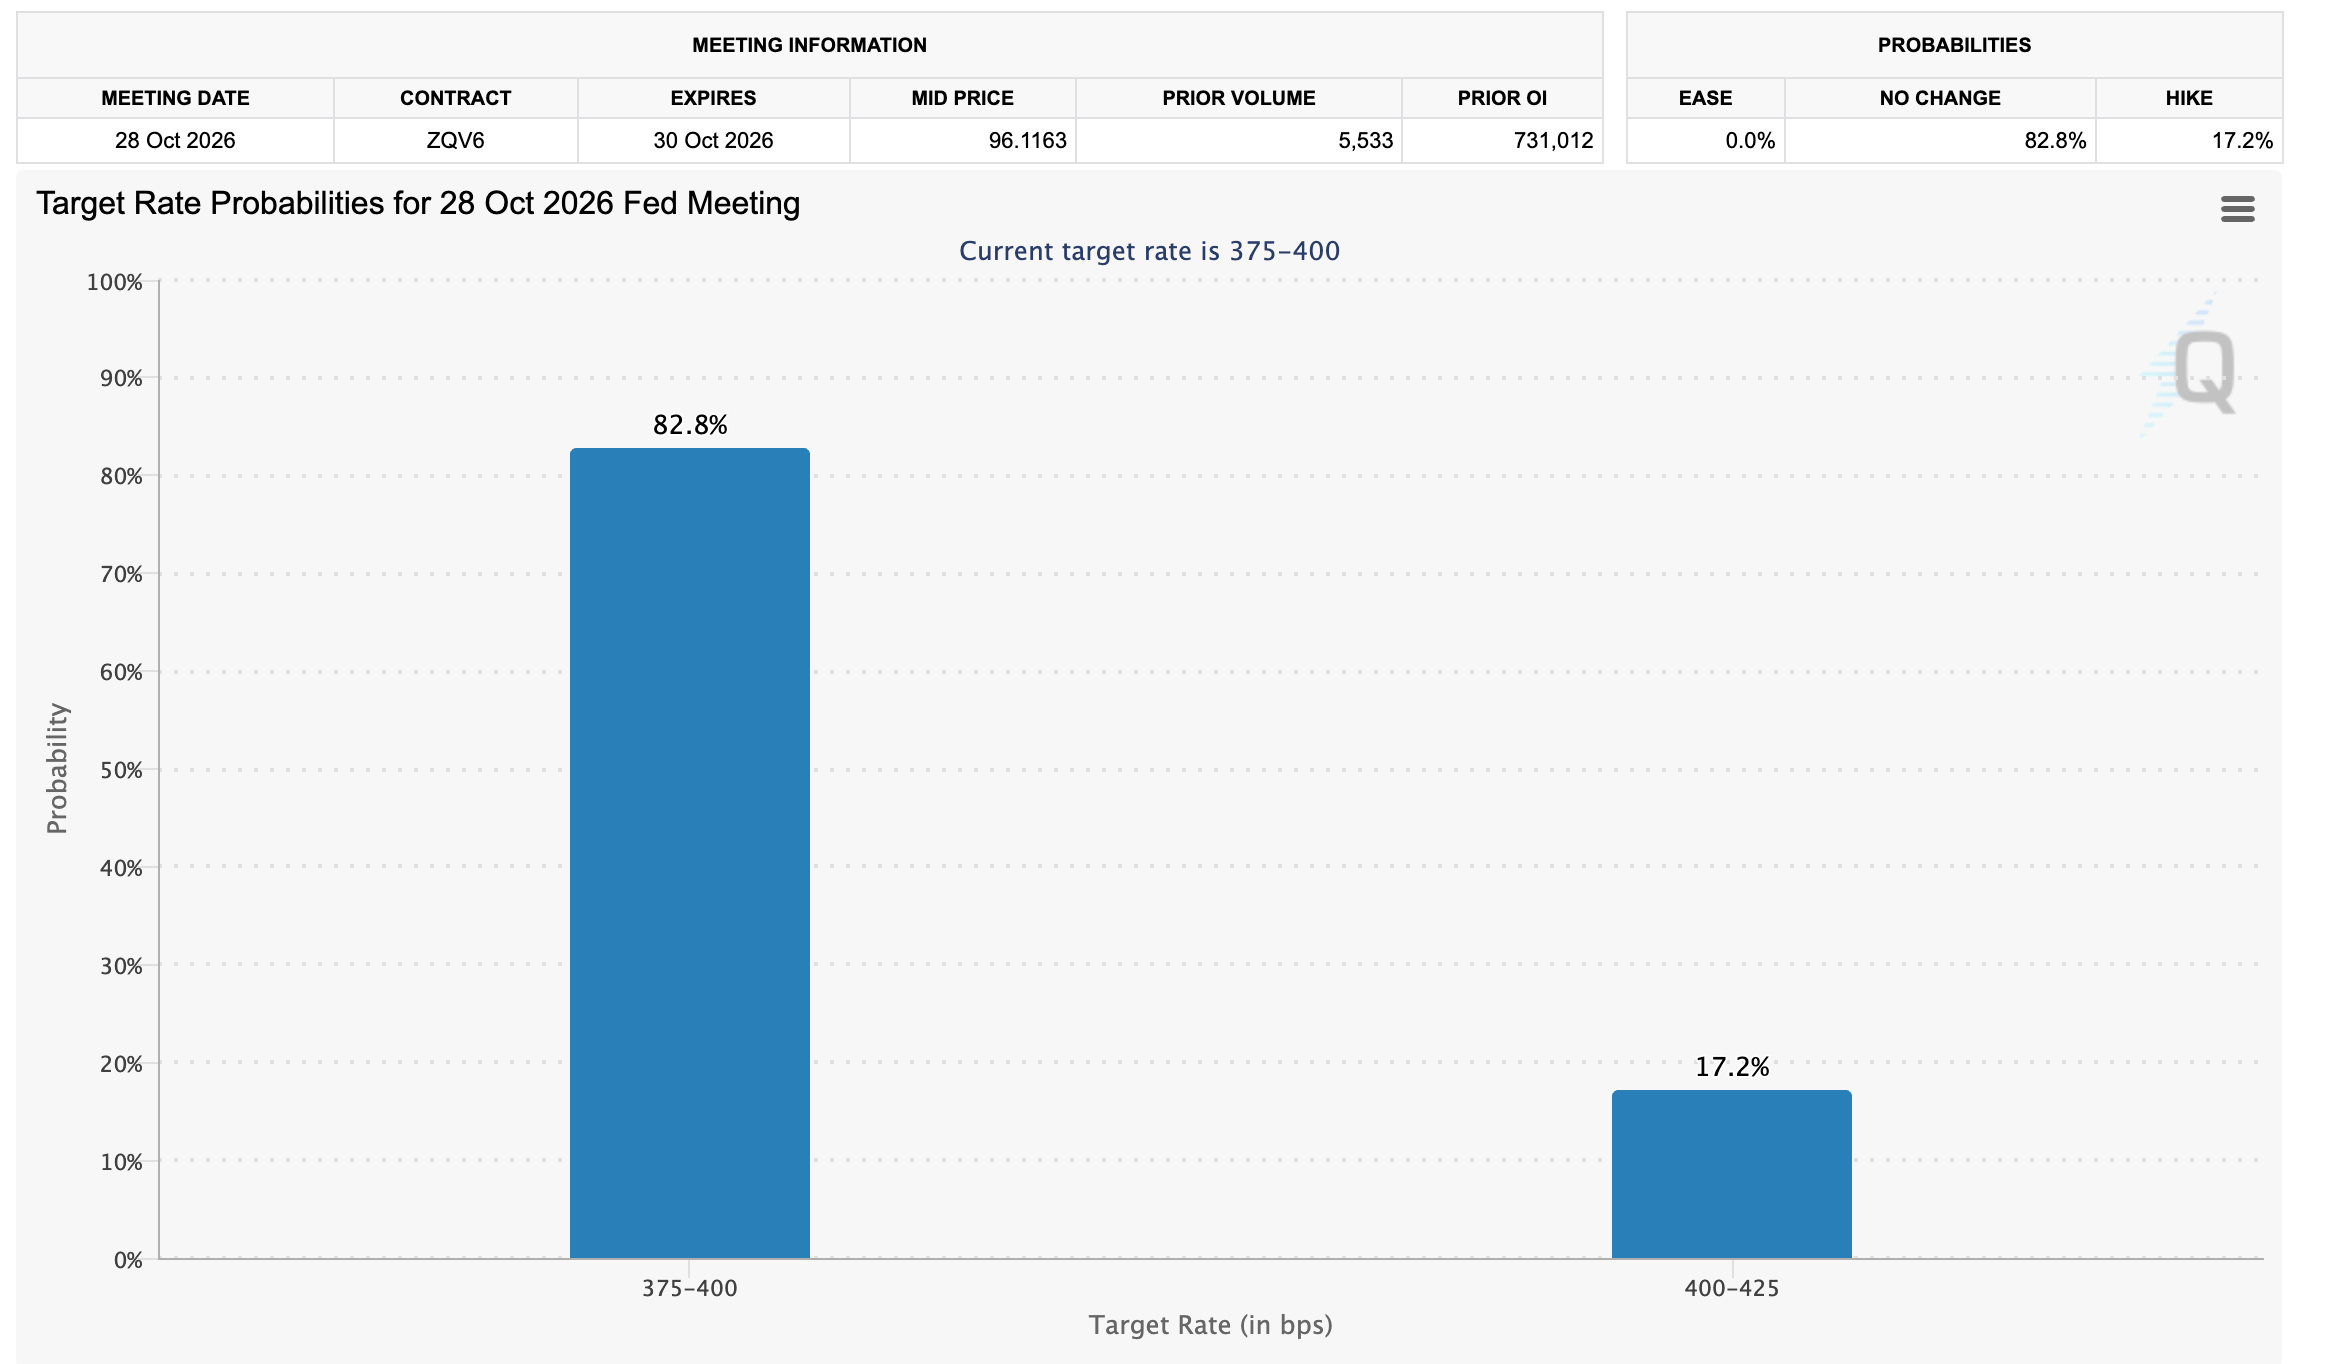
The cryptocurrency market attention remains firmly focused on the Federal Reserve’s (Fed) October 28 monetary policy decision. According to the CME FedWatch Tool, market participants widely expect, with an 83% probability, that the central bank will leave interest rates unchanged. They are also pricing in a 17% chance of a 25-basis-point hike.
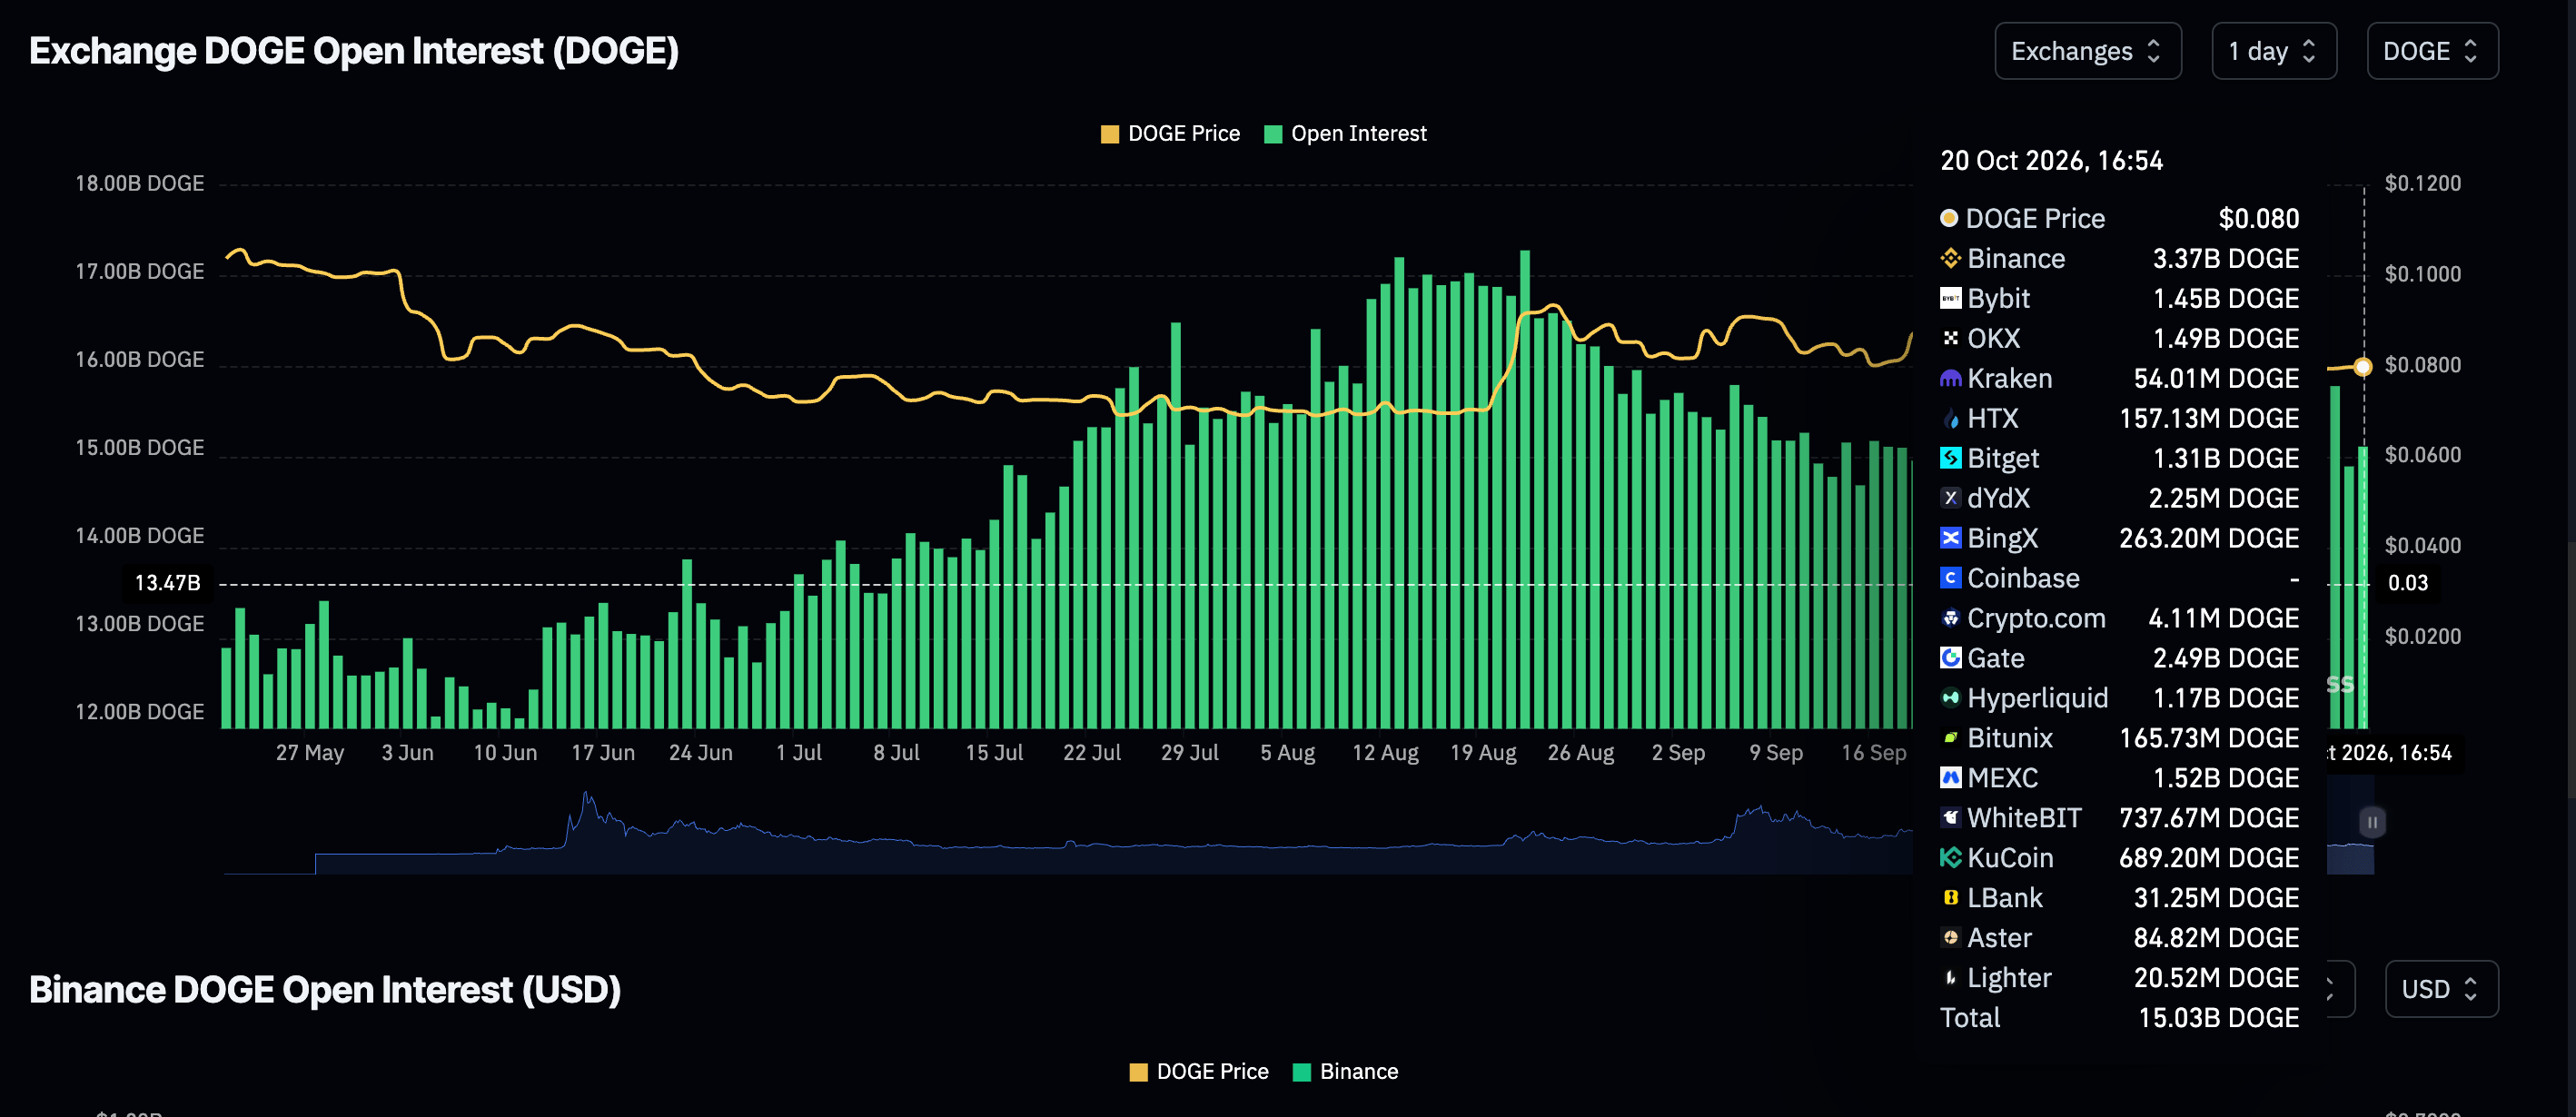
As for the derivatives market, retail participation is gradually rising. Perpetual Open Interest (OI) stood at roughly 15 billion DOGE on Tuesday, down from 15.7 billion DOGE the previous day. Looking back, aggregate OI has pulled back from highs above 17 billion DOGE recorded in August, suggesting softening leveraged positioning amid currently stabilizing price movement around $0.0800.
Technical analysis: Dogecoin bears retain structural control
Dogecoin trades at $0.0806, extending a corrective structure as price holds below the key Exponential Moving Averages (EMAs). The 50-day EMA at $0.0859 and the 100-day EMA at $0.0854 both sit overhead and hint at a capped recovery, while the 200-day EMA at $0.0919 and the SuperTrend line at $0.0912 reinforce a broader downside tone.
Momentum remains soft with the Relative Strength Index (RSI) hovering near 39 and the Moving Average Convergence Divergence (MACD) below zero, suggesting that sellers retain control despite the recent stabilization above $0.0800.
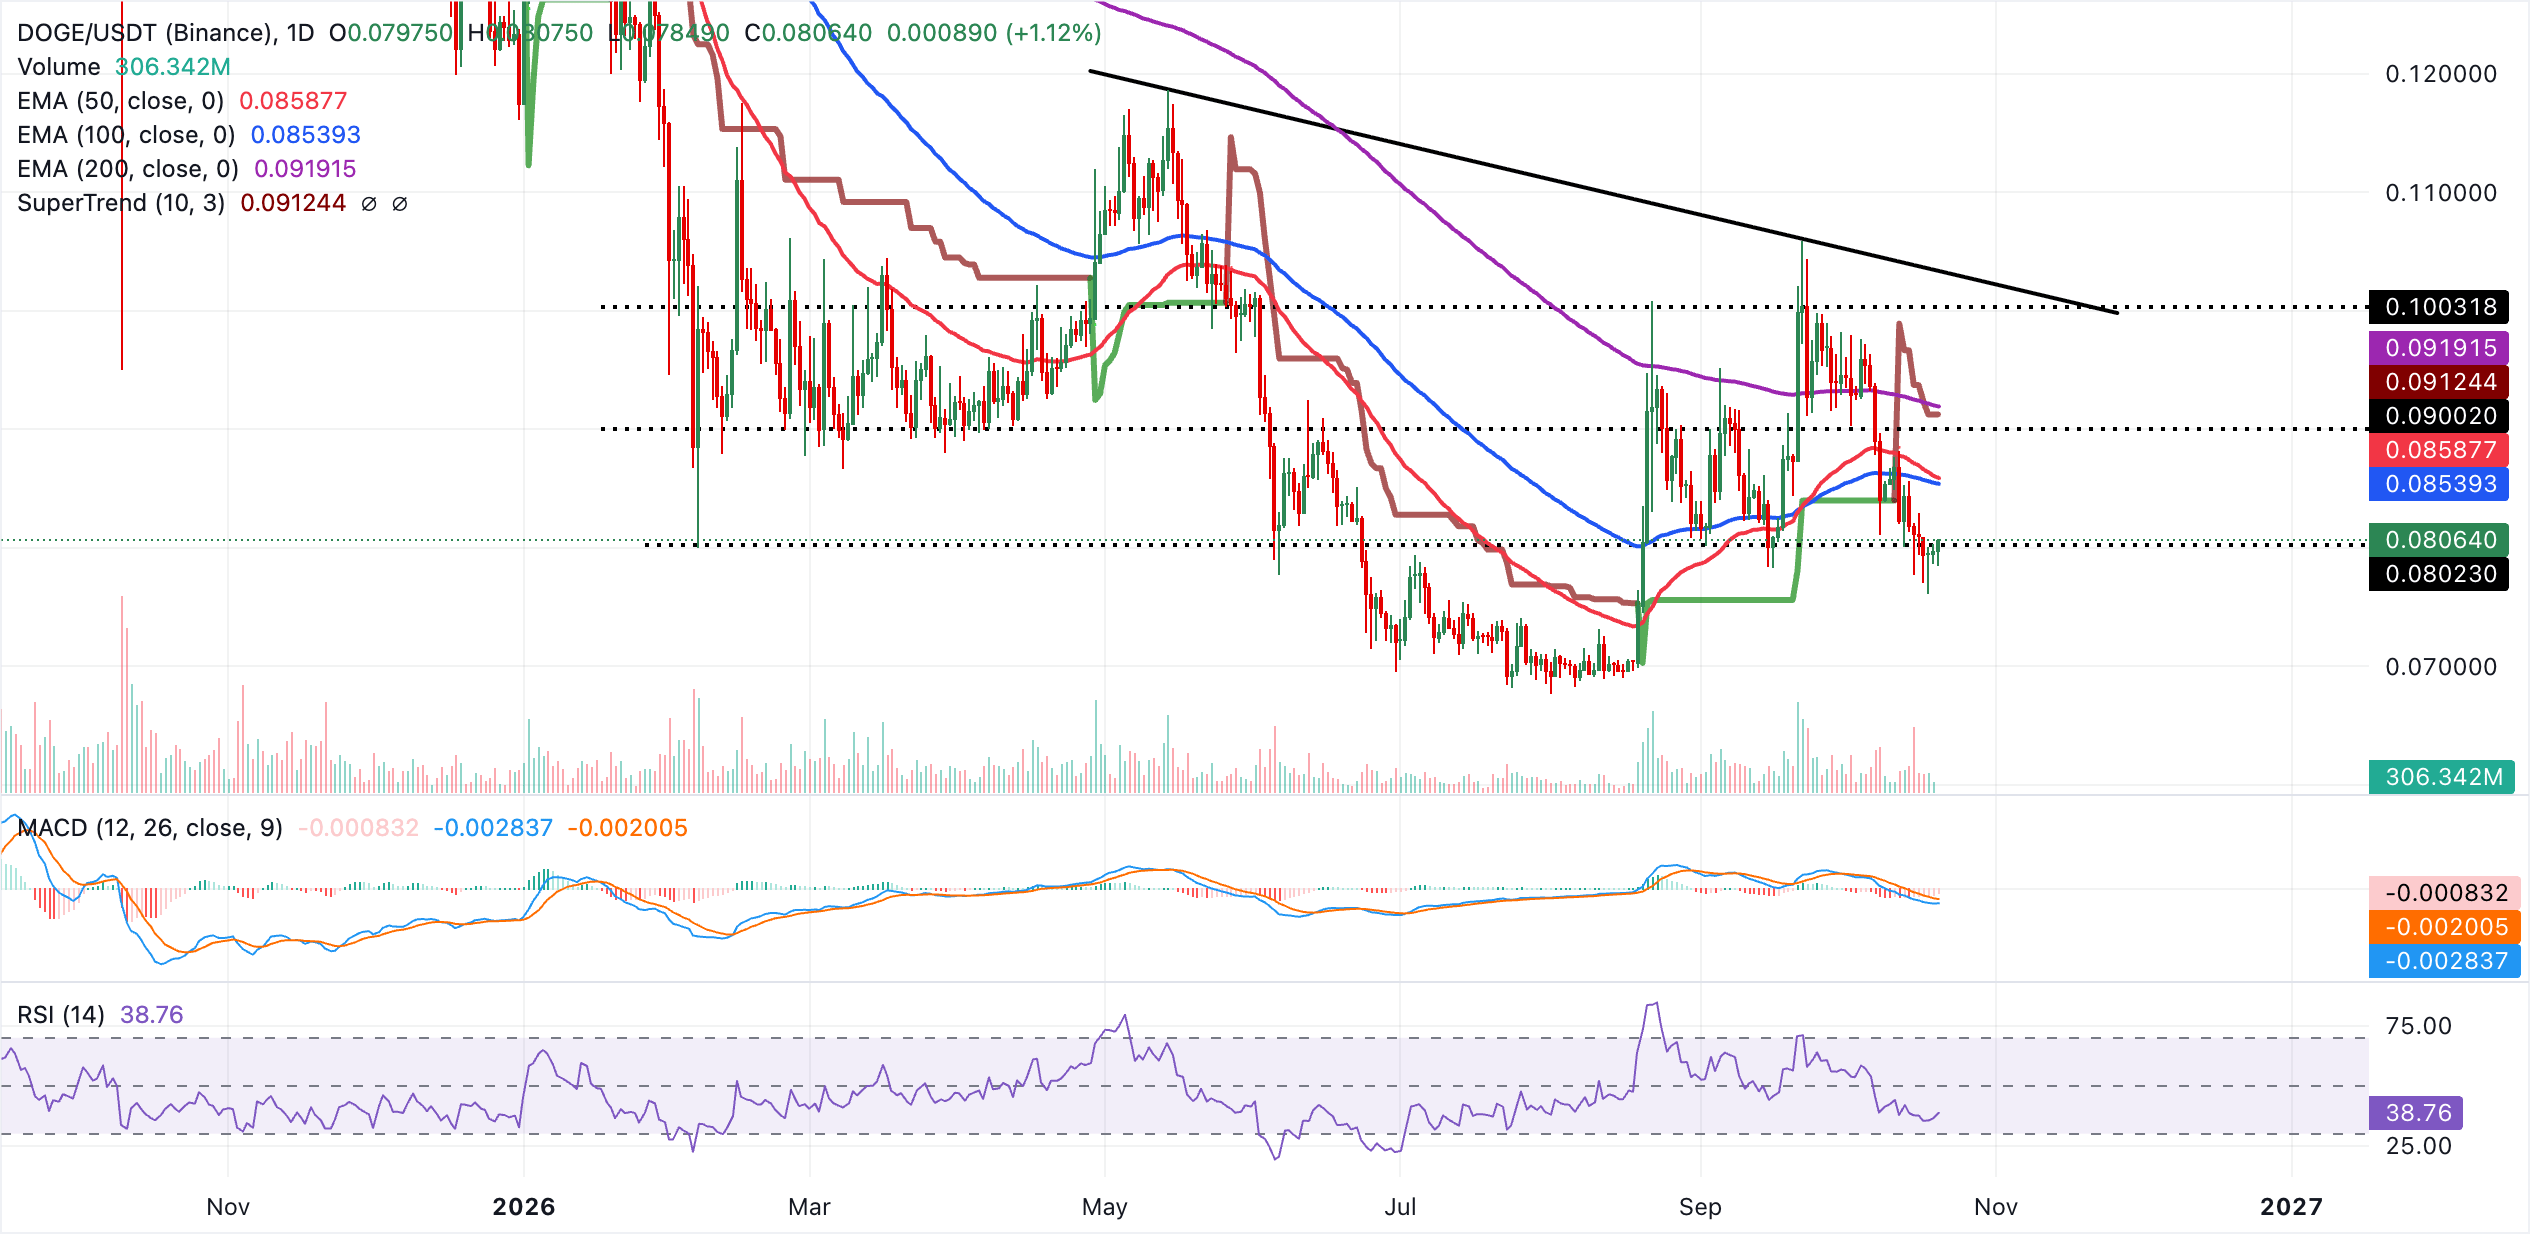
Initial resistance is in the $0.0854-$0.0859 cluster formed by the 100-day and 50-day EMAs, where any bounce would likely meet early supply. Above that, the SuperTrend level at $0.0912 aligns with the 200-day EMA at $0.0919 to form a stronger barrier, and only a daily close beyond this zone would begin to ease the prevailing bearish structure.
A further extension higher faces a structural hurdle at the prior downward trendline break around $0.1033, which marks the next objective for a more sustained recovery if buyers can reclaim the intermediate resistance layers first.
(The technical analysis of this story was written with the help of an AI tool. Know more.)
Open Interest, funding rate FAQs
Higher Open Interest is associated with higher liquidity and new capital inflow to the market. This is considered the equivalent of increase in efficiency and the ongoing trend continues. When Open Interest decreases, it is considered a sign of liquidation in the market, investors are leaving and the overall demand for an asset is on a decline, fueling a bearish sentiment among investors.
Funding fees bridge the difference between spot prices and prices of futures contracts of an asset by increasing liquidation risks faced by traders. A consistently high and positive funding rate implies there is a bullish sentiment among market participants and there is an expectation of a price hike. A consistently negative funding rate for an asset implies a bearish sentiment, indicating that traders expect the cryptocurrency’s price to fall and a bearish trend reversal is likely to occur.
Recommended Articles


