




Solana Price Forecast: SOL stalls around $100 amid weak institutional demand
- Solana hovers above $100 on Monday after a 2% decline the previous week, marking its third straight week of losses.
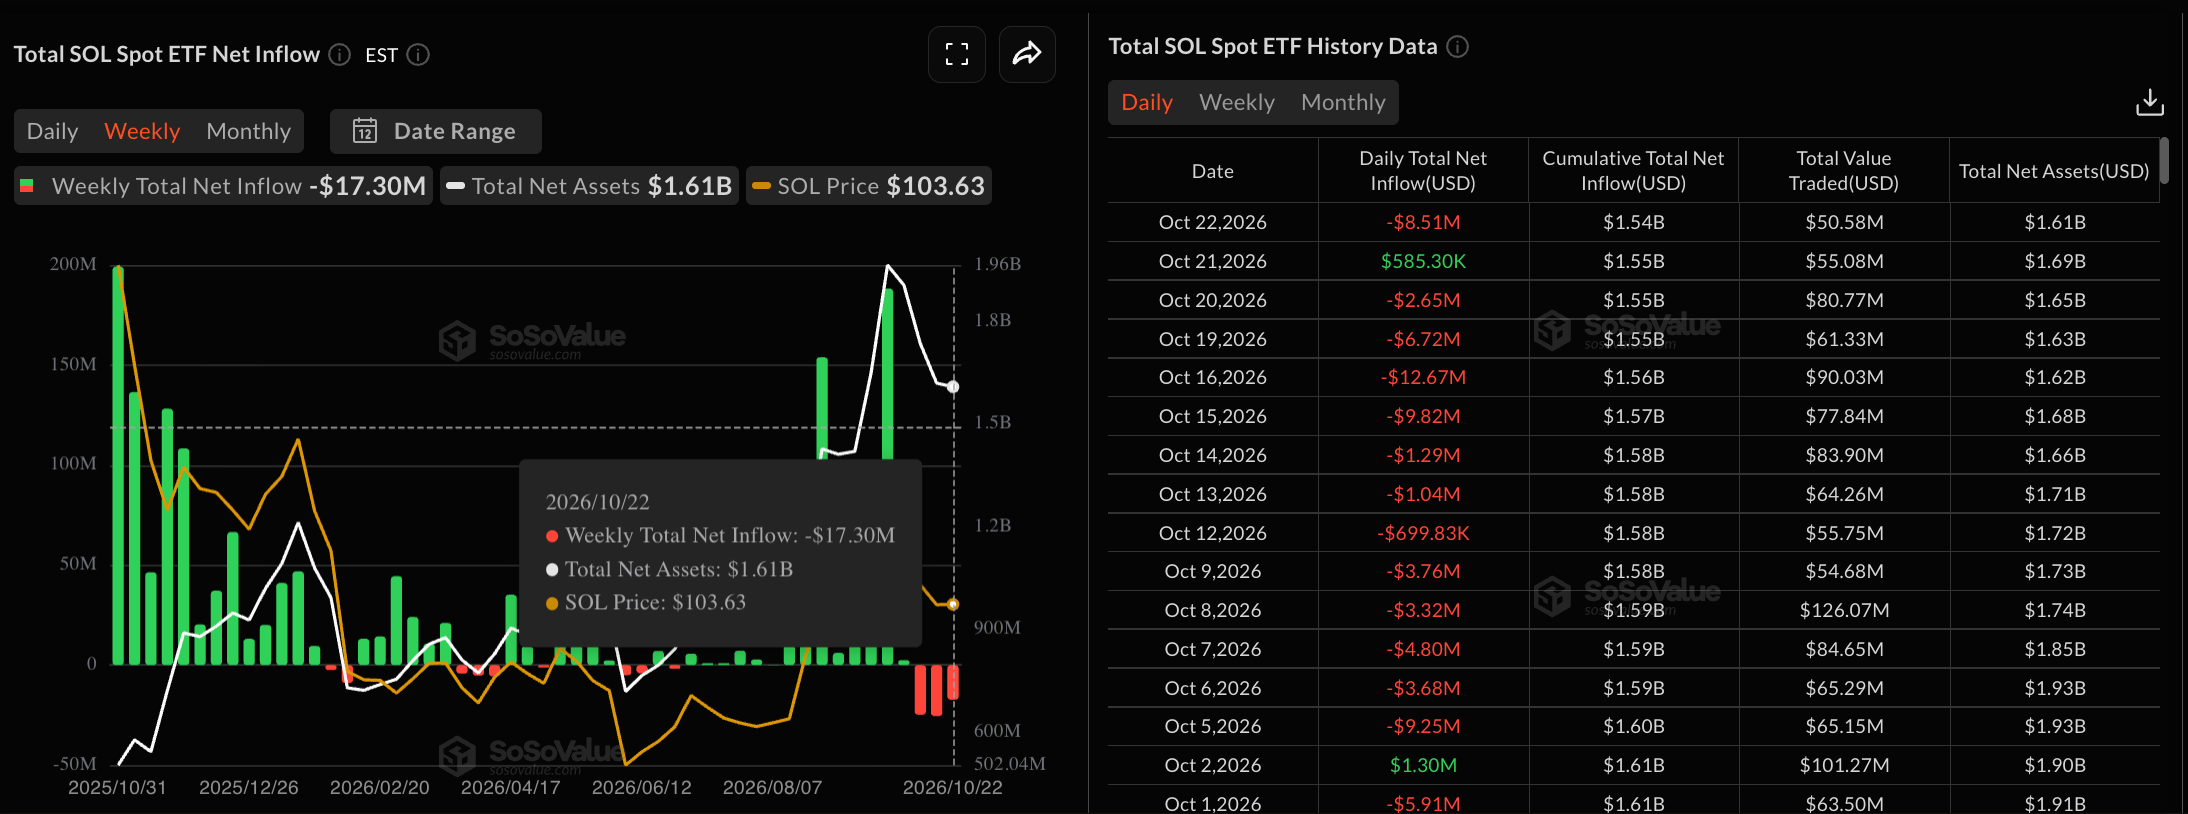
- SOL-focused ETFs recorded over $8 million in outflows on Friday, bringing their weekly total to more than $17 million.
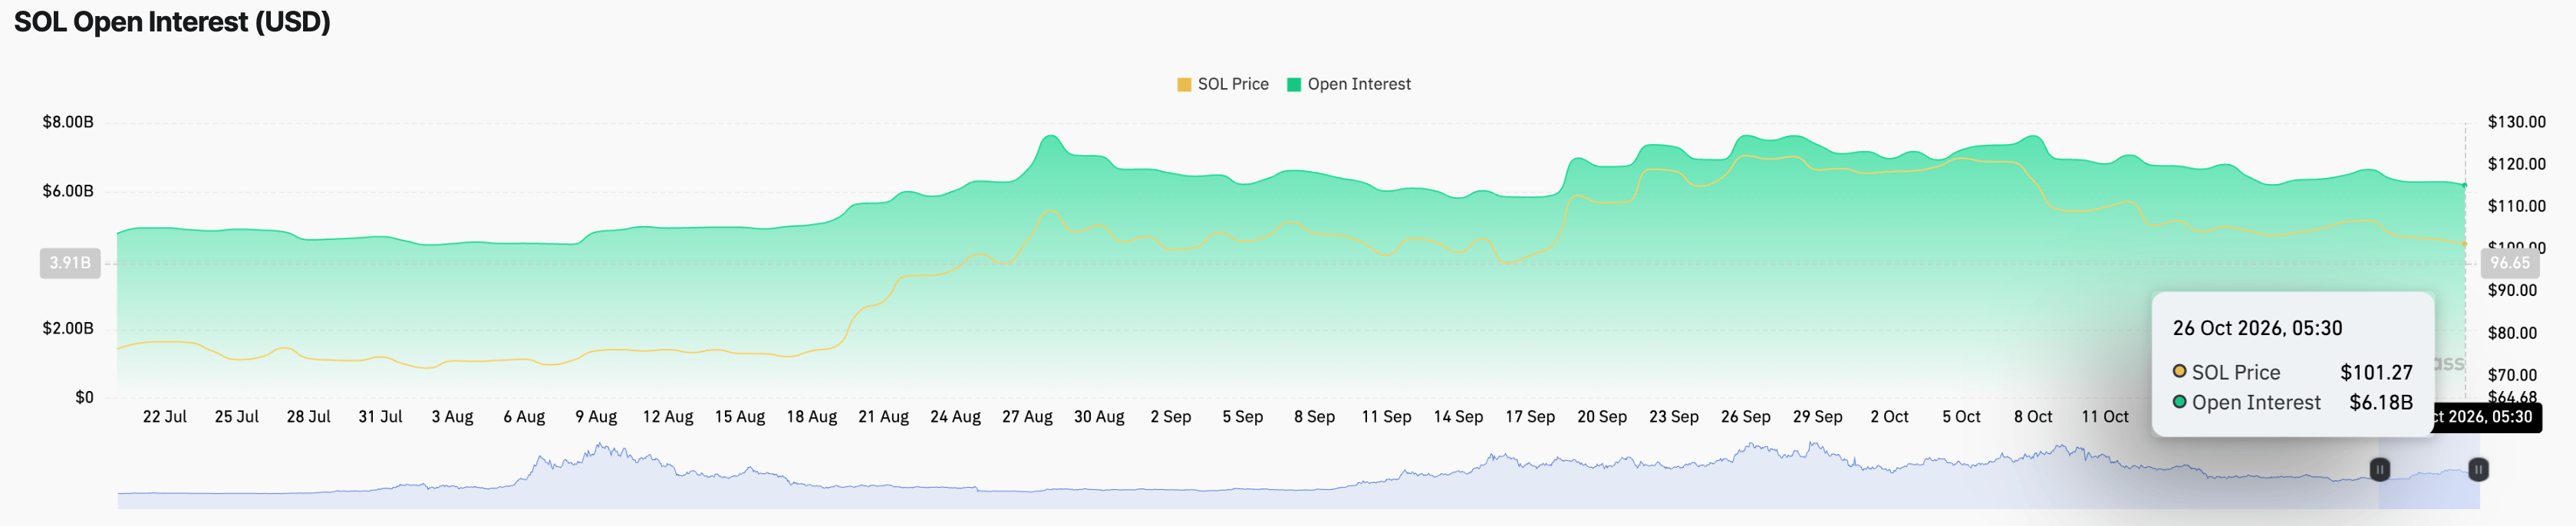
- Solana loses retail demand, with its futures Open Interest declining to $6.18 billion, from $6.34 billion last week.
Solana (SOL) price sustains above $100 on Monday, maintaining a near-term bearish bias after three consecutive weeks of losses, including a 2% decline last week. SOL-focused Exchange Traded Funds (ETFs) continue to face selling pressure from institutional investors, resulting in the third weekly outflow of over $17 million, while retail demand eases as Open Interest declines. The technical outlook for SOL is bearish, pressuring the long-term support of the 200-day Exponential Moving Average (EMA) around $98.
Solana ETFs face persistent selling pressure
Solana-focused ETFs face their third straight weekly outflow, with $17.30 million last week, bringing the monthly total to $72.24 million. Another week of outflows could push the monthly total above $1 million, marking the largest monthly outflow since June’s $786,580. Typically, ETF outflows suggest institutional investors are selling shares, reflecting reduced confidence in the underlying asset.
On the retail side, Solana futures are losing demand. CoinGlass data shows that SOL futures Open Interest (OI) is down to $6.18 billion on Monday, from $6.34 billion last week, indicating a reduced notional value of active contracts amid a declining spot price and a potential positional wipeout.
Taken together, the Layer-1 token continues to face weak demand, despite last week’s Alpenglow upgrade, which replaced the old TowerBFT system with a new engine, Votor, reducing transaction finality from roughly 12 seconds to a targeted 150 milliseconds.
Technical outlook: Will SOL price rebound from $100?
Solana trades at $101.45 at press time on Monday, retaining a capped bias below the 50-day EMA at $105.99 while staying above the 200-day EMA at $98.27. This split in the major averages suggests a corrective phase within a broader uptrend, with the upward-sloping support trendline around $86.67 reinforcing the underlying structure.
Momentum remains soft, as the Relative Strength Index (RSI) is at 36 on the daily chart, while the Moving Average Convergence Divergence (MACD) line is marginally below the signal line in negative territory, hinting at persistent downside pressure.
The 200-day EMA at $98.27 offers the first meaningful layer of support, and a confirmed break below it could extend the decline toward the rising trendline near $86.67, where stronger buying interest would be expected if the pullback continues.
On the topside, initial resistance is located at the 50-day EMA near $105.99, which guards the path toward the more distant horizontal barrier at the September 25 high of $122.94.
(The technical analysis of this story was written with the help of an AI tool. Know more.)
Recommended Articles


