



Cardano Price Forecast: Derivatives and on-chain data confirm bears in control

Source Fxstreet
  • Cardano extends losses, trading below $0.202 on Monday after recording three straight weeks of declines.
  • Weakening derivatives positioning and bearish on-chain signs support further losses.
  • The technical outlook shows bears controlling momentum, increasing the risk of a deeper correction.

Cardano (ADA) extends losses, trading below $0.202 on Monday after three consecutive weeks of more than 20% declines since early October. Selling pressure continues to build as weakening derivatives metrics, bearish on-chain signals and a deteriorating technical outlook point to further downside risks.

Derivatives metrics support a bearish outlook

Derivatives data shows a bearish bias for Cardano. CoinGlass’ long-to-short ratio for ADA reads 0.70 on Monday, nearing the lowest level over a month. A ratio below one indicates bearish sentiment, as traders bet that asset prices will fall.
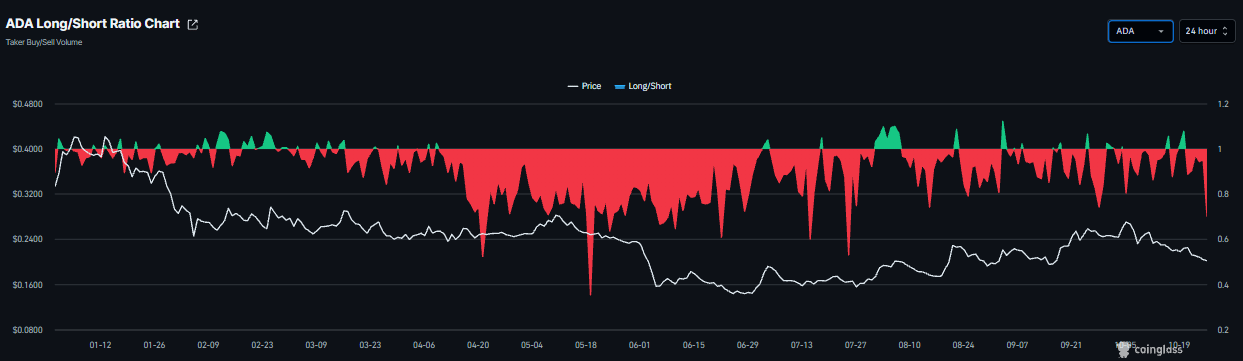
ADA long-to-short ratio chart. Source: Coinglass

In addition, Cardano’s funding rate flipped negative on Monday and reads -0.0032%, indicating shorts are paying longs and suggesting a bearish outlook.
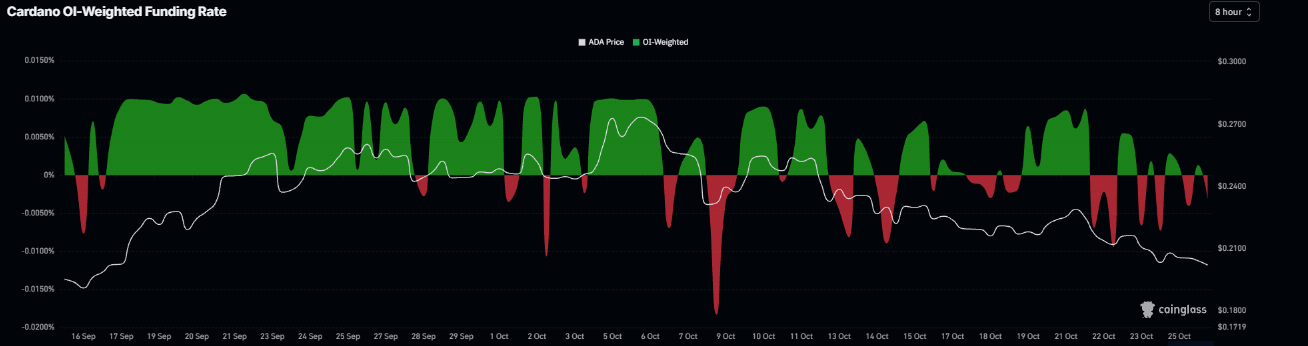
ADA funding rates chart. Source: Coinglass

On-chain data shows a cautious outlook

CryptoQuant’s summary data shows a cautious tone. ADA’s futures markets show large whale orders alongside overheating conditions. In addition, the spot and futures markets show sell-side dominance. These highlight a bearish, cautious sentiment bias among Cardano traders.
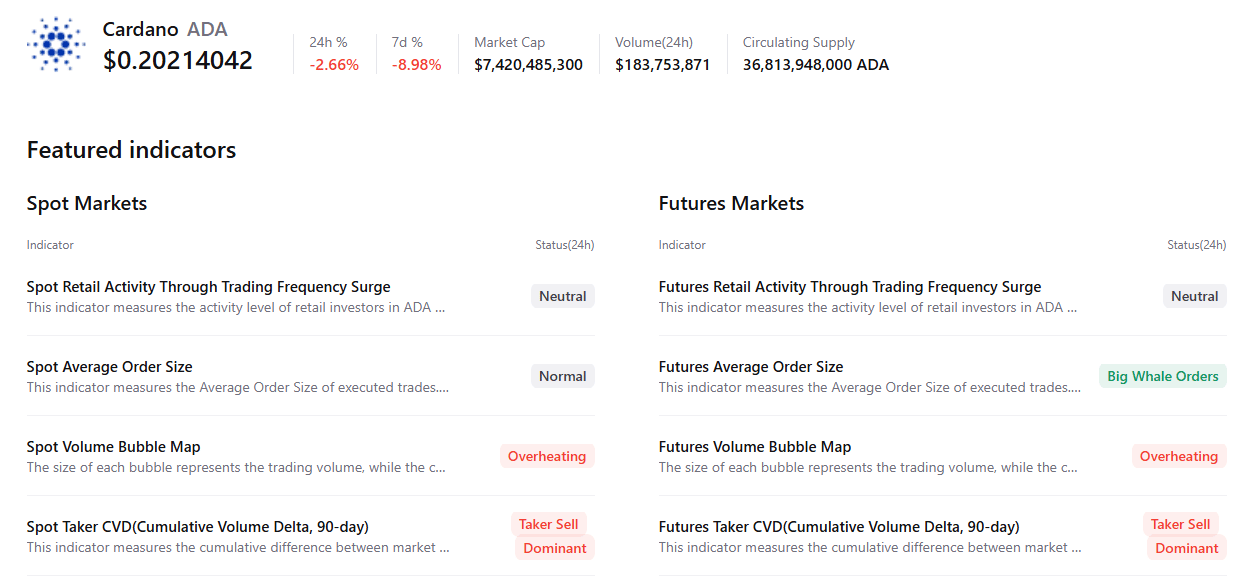
Cardano summary chart. Source: CryptoQuant

Cardano technical outlook: Bears in control

Cardano price trades at $0.201 on Monday, extending a bearish near-term bias as it holds beneath the 50-day, 100-day, and 200-day Exponential Moving Averages (EMAs) clustered between roughly $0.218 and $0.237.

The failed upward trendline break around $0.213 now acts as immediate resistance, while the Relative Strength Index (RSI) at 33 hovers just above oversold territory, hinting at persistent downside pressure but a risk of short-lived corrective bounces. The Moving Average Convergence Divergence (MACD) indicator remains negative, with the line below the signal and a flat bearish profile, reinforcing the view that rallies are likely to be capped by the overhead EMA stack.

On the topside, initial resistance is seen at the former trendline break near $0.213, followed by the 100-day EMA at $0.218 and the 50-day EMA at $0.224. Above these, horizontal barriers emerge at $0.236 and $0.245, with the 200-day EMA at $0.237 adding to supply in that zone, before a more distant resistance level at $0.299.

On the downside, structural support is much lower at the earlier downward trendline break around $0.081, leaving ADA exposed. At the same time, it trades in open air between current prices and that deeper technical floor.
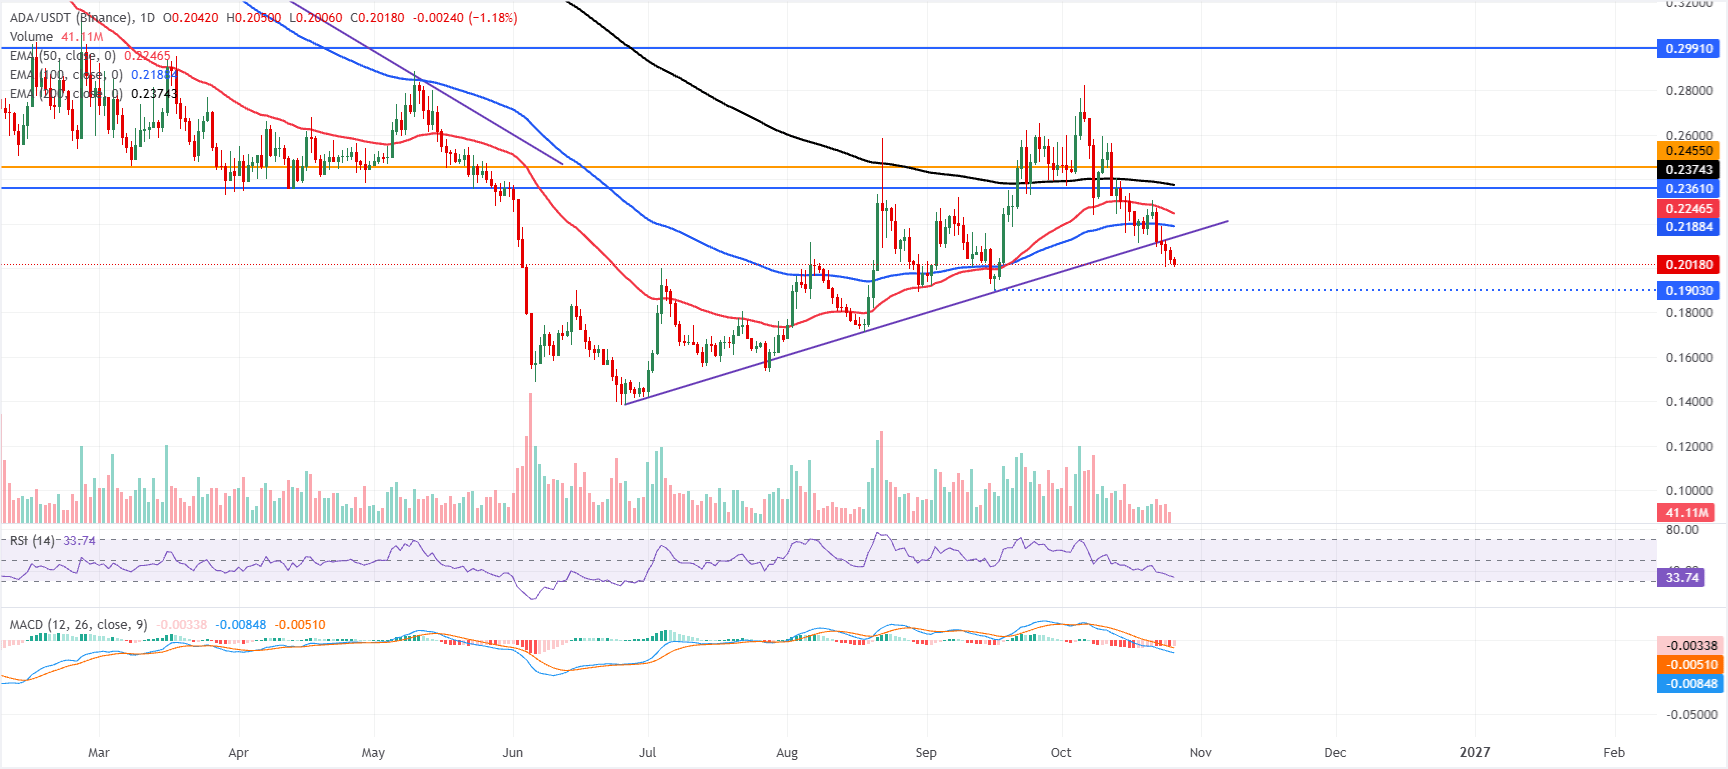
ADA/USDT daily chart

(The technical analysis of this story was written with the help of an AI tool. Know more.)

Disclaimer: For information purposes only. Past performance is not indicative of future results.
placeholder
Bank of America Sets a New Target For Gold Price By the End of 2026Bank of America (BofA) expects gold below $4,000 over the next three months. The bank forecasts an average of $4,000 per ounce in the fourth quarter.Gold traded around $4,100 on Wednesday after hotter
Author  FXStreet
Oct 15, Thu
Bank of America (BofA) expects gold below $4,000 over the next three months. The bank forecasts an average of $4,000 per ounce in the fourth quarter.Gold traded around $4,100 on Wednesday after hotter
placeholder
What History Says Happens After Chip Stocks Have a Week This BadBTIG has told investors to use any rebound in semiconductor stocks to cut their exposure. The firm expects a drawn-out decline in the sector that could stretch into 2027.The warning followed an 11.4%
Author  Beincrypto
Oct 20, Tue
BTIG has told investors to use any rebound in semiconductor stocks to cut their exposure. The firm expects a drawn-out decline in the sector that could stretch into 2027.The warning followed an 11.4%
placeholder
Will Brent Jump 28% Again? US and Israel Draft Post-Midterm Iran Strike PlansThe US and Israel have drafted plans for Iran strikes after the Nov. 3 midterms, The New York Times reports. Energy sites appear on the reported target list, with Brent crude already near $109 a barre
Author  Beincrypto
Oct 22, Thu
The US and Israel have drafted plans for Iran strikes after the Nov. 3 midterms, The New York Times reports. Energy sites appear on the reported target list, with Brent crude already near $109 a barre
placeholder
Weekly Market Wrap: Meta’s $145 billion AI bill hit chips — as Brent surged past $116Meta’s US$145 billion AI spending plan puts chip stocks in focus as Brent crude surges past US$116. Explore this week’s key market moves, investor concerns and what Australian traders should watch next.
Author  Mark Garro
2 hours ago
Meta’s US$145 billion AI spending plan puts chip stocks in focus as Brent crude surges past US$116. Explore this week’s key market moves, investor concerns and what Australian traders should watch next.
placeholder
Fed Week Puts Stocks, Bitcoin, and DXY on Collision Course Before $11 Billion ExpiryOne week could decide what your stocks, your Bitcoin (BTC), and your dollars are worth by Christmas. From Wednesday to Friday, the Federal Reserve meets, inflation data lands, and $11 billion in Bitco
Author  Beincrypto
2 hours ago
One week could decide what your stocks, your Bitcoin (BTC), and your dollars are worth by Christmas. From Wednesday to Friday, the Federal Reserve meets, inflation data lands, and $11 billion in Bitco
Related Instrument
goTop
quote