




Top 3 Price Prediction: Bitcoin, Ethereum, Ripple – BTC gains strength as ETH and XRP selling eases
- Bitcoin hovers near $83,000 on Wednesday, sustaining its mild rebound from its 50-day EMA at $80,796 the previous day.
- Ethereum remains capped by the 50-day EMA at $2,480 as bearish momentum wanes.
- Ripple at $1.33 holds steady after gaining over 2% the previous day, suggesting easing downside pressure.
Top three cryptocurrencies, Bitcoin (BTC), Ethereum (ETH), and Ripple (XRP), are holding steady on Wednesday after a bullish close the previous day. The mild recovery hints at an extended rally as the prevailing bearish pressure eases.
Bitcoin prepares for a bullish turnaround
Bitcoin trades at $82,930 on Wednesday, holding a bullish near-term bias following a mild rebound the previous day. The King crypto remains above both the 50-day Exponential Moving Average (EMA) at $80,769 and the 200-day EMA at $76,090, suggesting a constructive backdrop.
Bearish momentum is easing as the Moving Average Convergence Divergence (MACD) is on the verge of crossing above its signal line on the daily chart, while the Relative Strength Index (RSI) is around 52, suggesting neutral conditions.
An extended recovery in BTC could encounter initial resistance at the 78.6% Fibonacci retracement level of $89,337, ahead of the cycle-high area defined by the 100% retracement at $97,924, with the lower anchor at $57,800.
On the downside, immediate support emerges at the 50-day EMA near $80,769, while deeper layers of demand align with the 200-day EMA at $76,090 and the 50% Fibonacci level at $77,862.
Ethereum eyes 50-day EMA breakout
Ethereum trades at $2,449, maintaining a capped tone as it holds below the 50-day EMA at $2,480 but remains above the 200-day EMA at $2,326.56. This split in the trend backdrop hints at consolidation within a broader bullish structure, with near-term pressure skewed to the downside.
The MACD line is now marginally below its signal line in negative territory, while the RSI hovers near 43, both suggesting fading downside momentum and reinforcing the idea of a corrective phase.
Immediate resistance is located at the 50-day EMA at $2,480, and a sustained close above this barrier would ease the current downside bias. This could also reopen the path toward higher levels, including the August 21 and September 21 highs around $2,546 and $2,807, respectively.
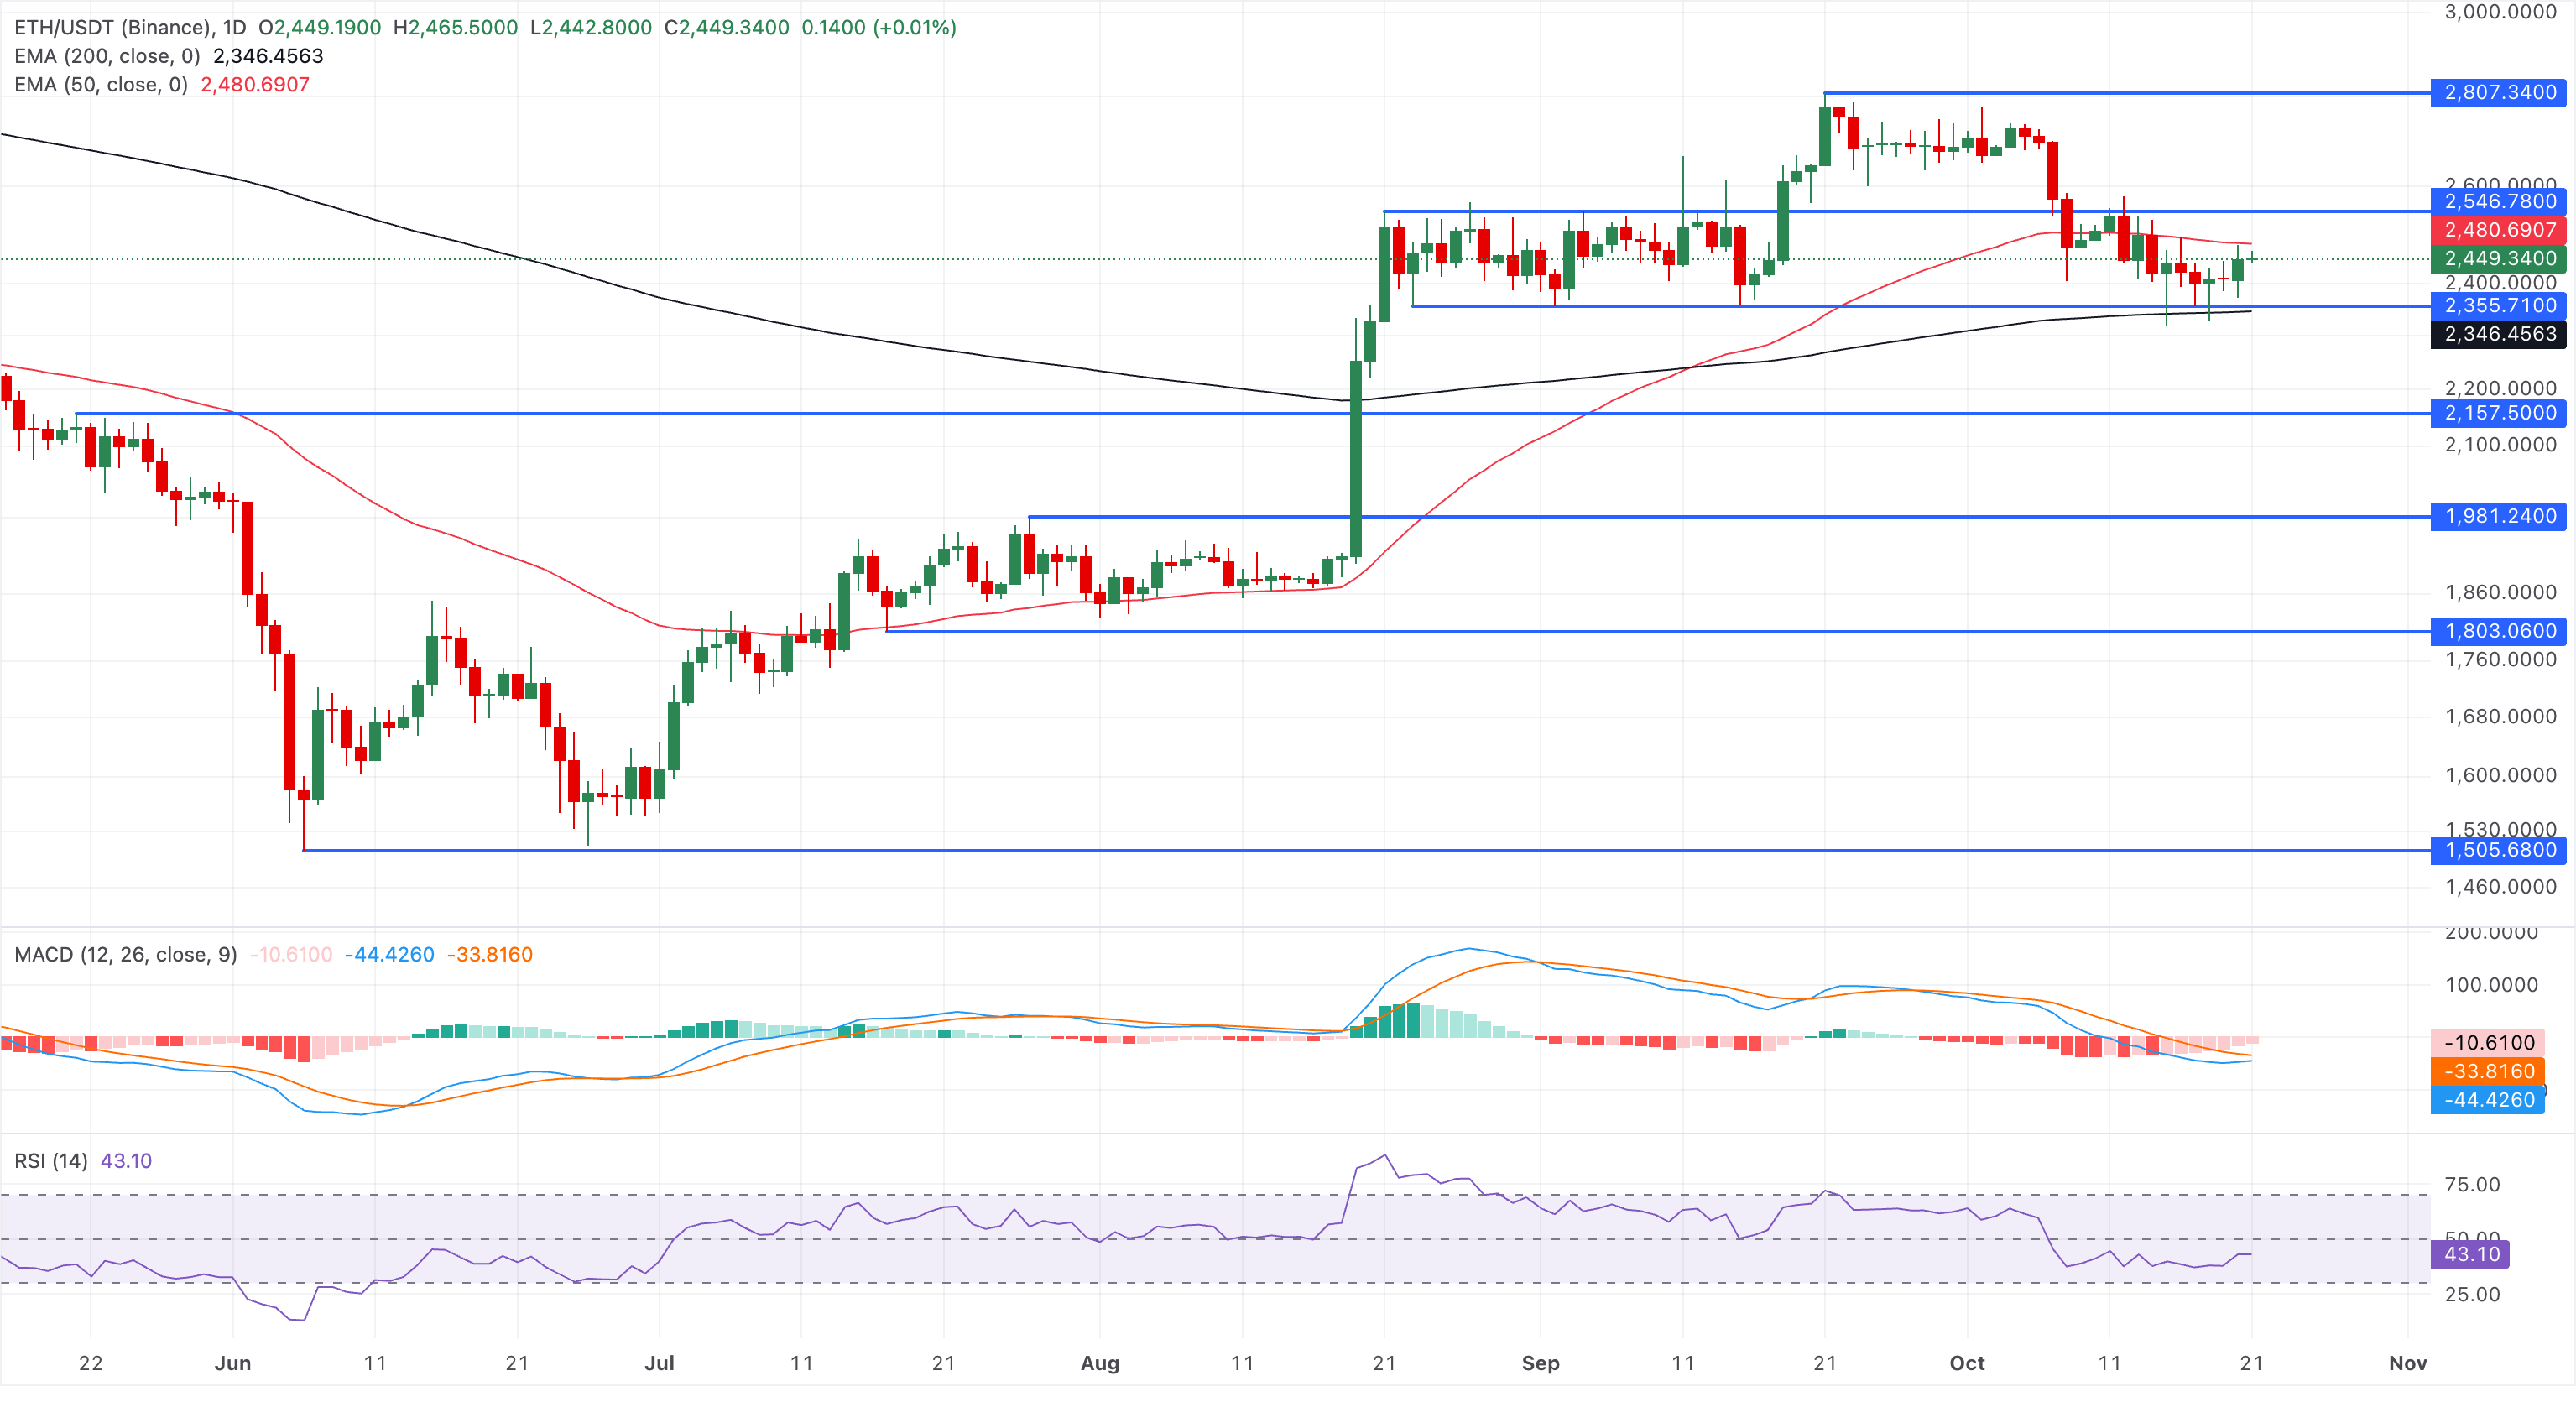
Looking down, the major altcoin is supported by the 200-day EMA near $2,326, where buyers are likely to defend the broader uptrend. A decisive break below this floor would signal a deeper pullback toward the May 21 high at $2,157.
Ripple takes a bullish stand
Ripple trades at $1.333, holding steady after a more than 2% rebound the previous day. Still, XRP remains below the 50-day EMA at $1.3748 and the 200-day EMA at $1.3954, suggesting the broader uptrend is losing traction. The breakout below the upward support trendline at $1.3594 further caps the topside.
From a technical perspective, the price shows near-term bullish support holding at the horizontal level set by the June 15 high at $1.2941. To reinstate an upward trend, XRP price must reclaim the 50- and 200-day EMAs around $1.3748 and $1.3954, respectively, which could ease the prevailing downside pressure.
Momentum aligns with this capped structure, as the RSI at 42 remains in the lower half of its range and the MACD nears its signal line amid a waning negative histogram, hinting at easing selling pressure.
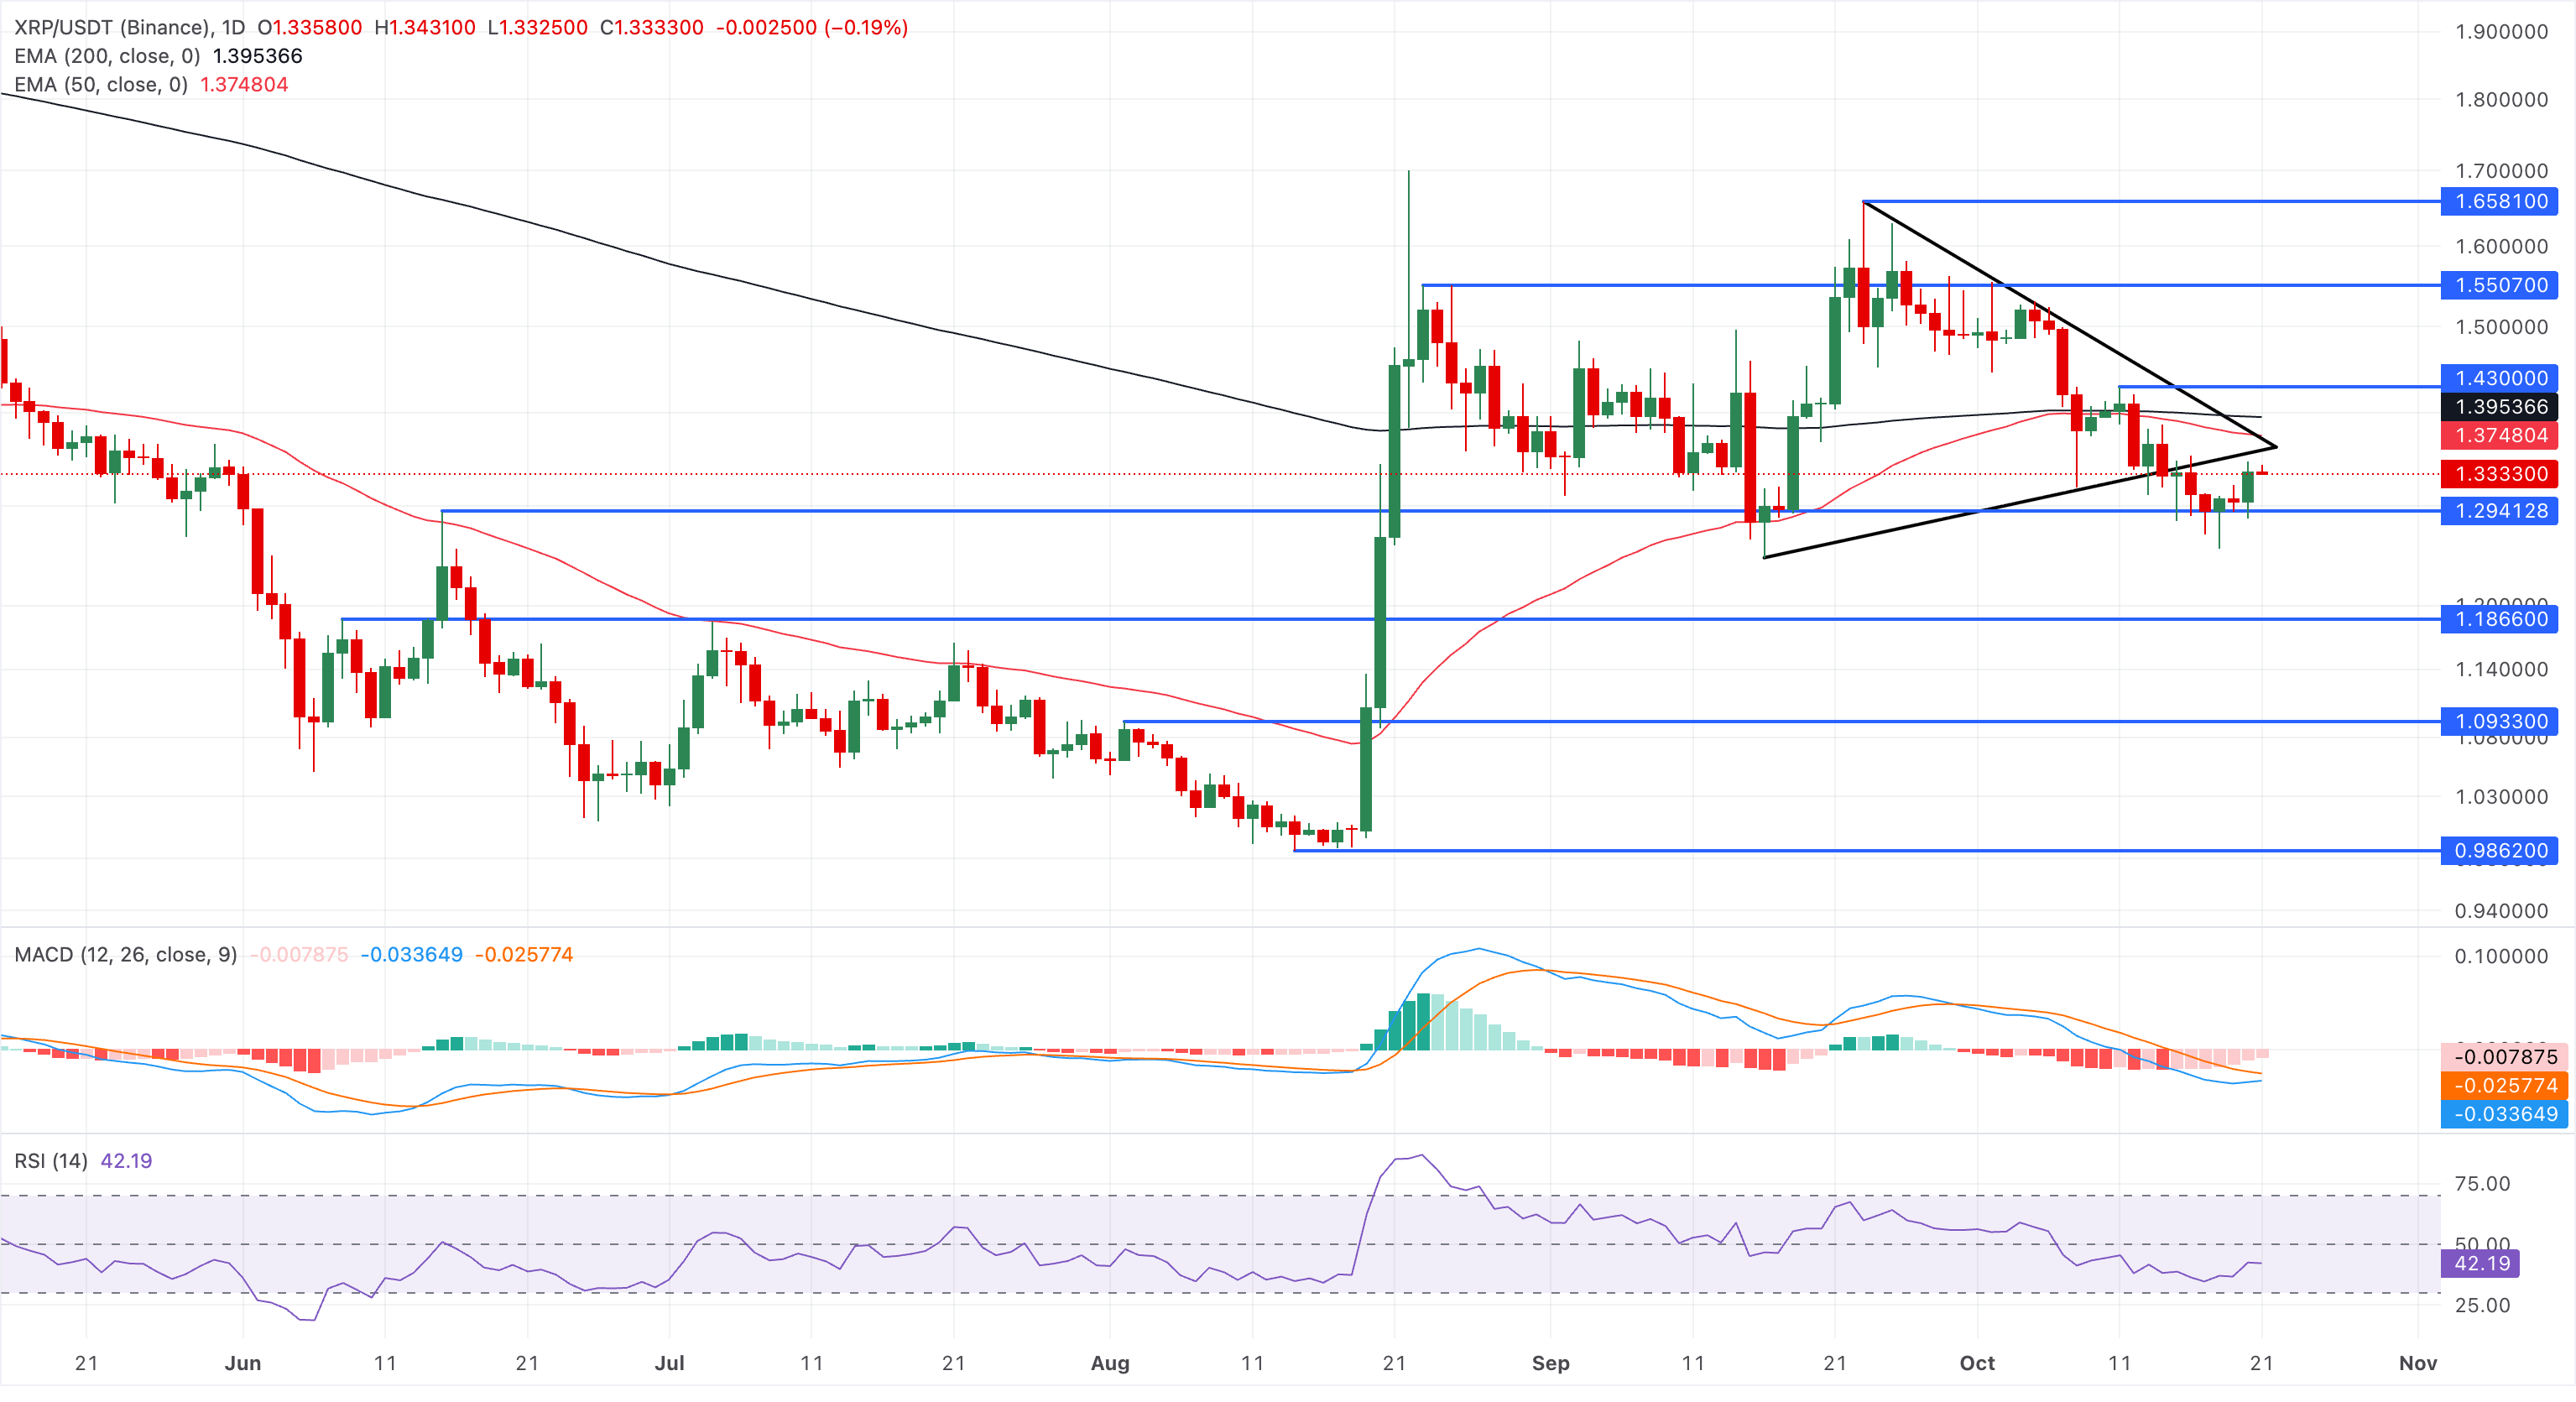
Looking down, a sustained breakout below $1.2941 could extend the decline toward the June 8 high at $1.1866.
(The technical analysis of this story was written with the help of an AI tool. Know more.)
Recommended Articles


