



Cardano Price Forecast: Retail support wanes as ADA tests a make-or-break level

Source Fxstreet
  • Cardano recovers nearly 2% on Tuesday, sustaining above its 50-day EMA at $0.2302 after the previous day’s roughly 8% decline.
  • ADA derivatives data shows a decline in Open Interest as funding rates flip negative, suggesting reduced speculative demand.
  • The technical outlook for ADA is mixed, with price testing a crucial support cluster near $0.2300 amid mounting selling pressure.

Cardano (ADA) price is up nearly 2% at press time on Tuesday, holding above its 50-day Exponential Moving Average (EMA) at $0.2302 and a near-term rising support trendline at $0.2264. ADA is losing retail demand in the derivatives market as its futures Open Interest declines and funding rates flip negative. The technical outlook for ADA is mixed, with the price testing a crucial support cluster near $0.2300 as easing momentum warns of a bearish shift.

ADA loses retail support

Cardano sees reduced retail participation in leveraged derivatives, implying a downside bias in investors' sentiment. CoinGlass data shows ADA futures Open Interest (OI) is down to $504.96 million on Tuesday, from $549.14 million the previous day, indicating a lower notional value of open contracts. 

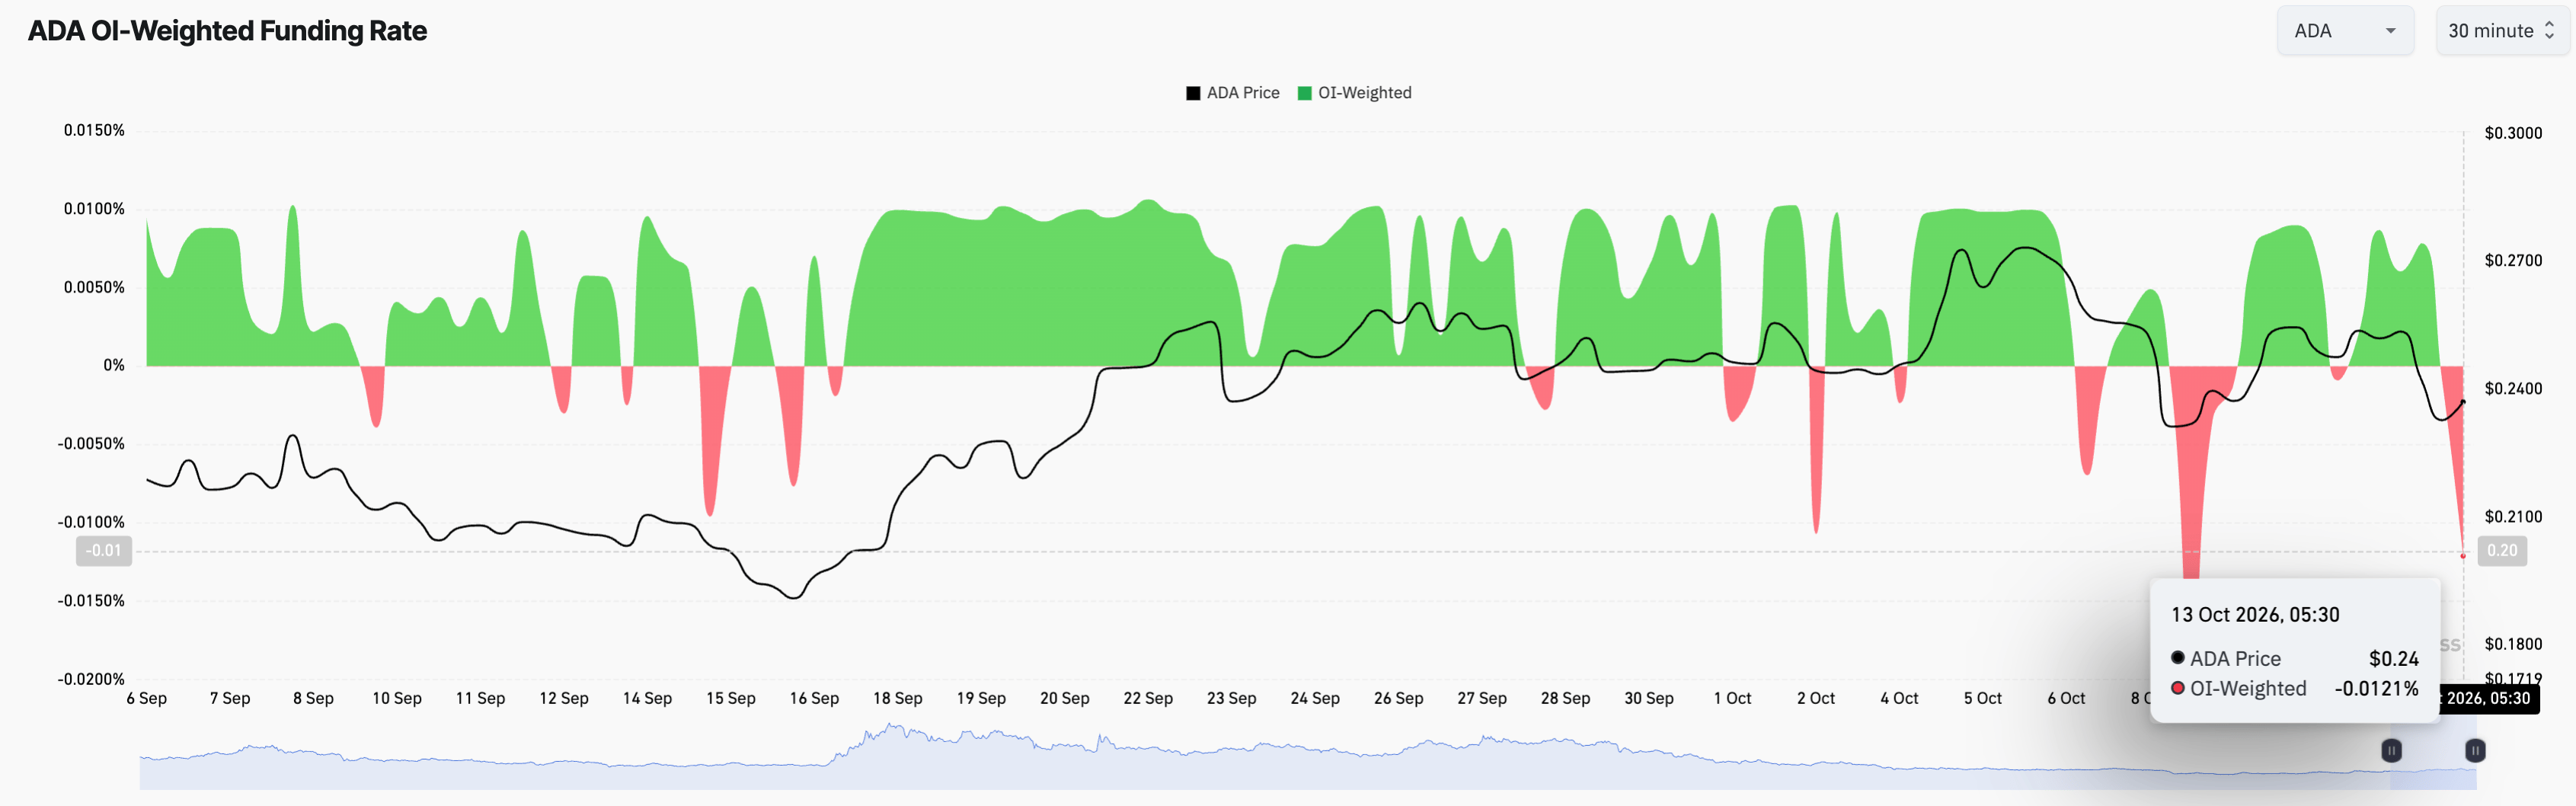
At the same time, the OI-weighted funding rate drops below zero to -0.0121% from 0.0078%, suggesting increased interest among traders in buying short positions. This implies a bearish bias among traders, as they anticipate further downside.
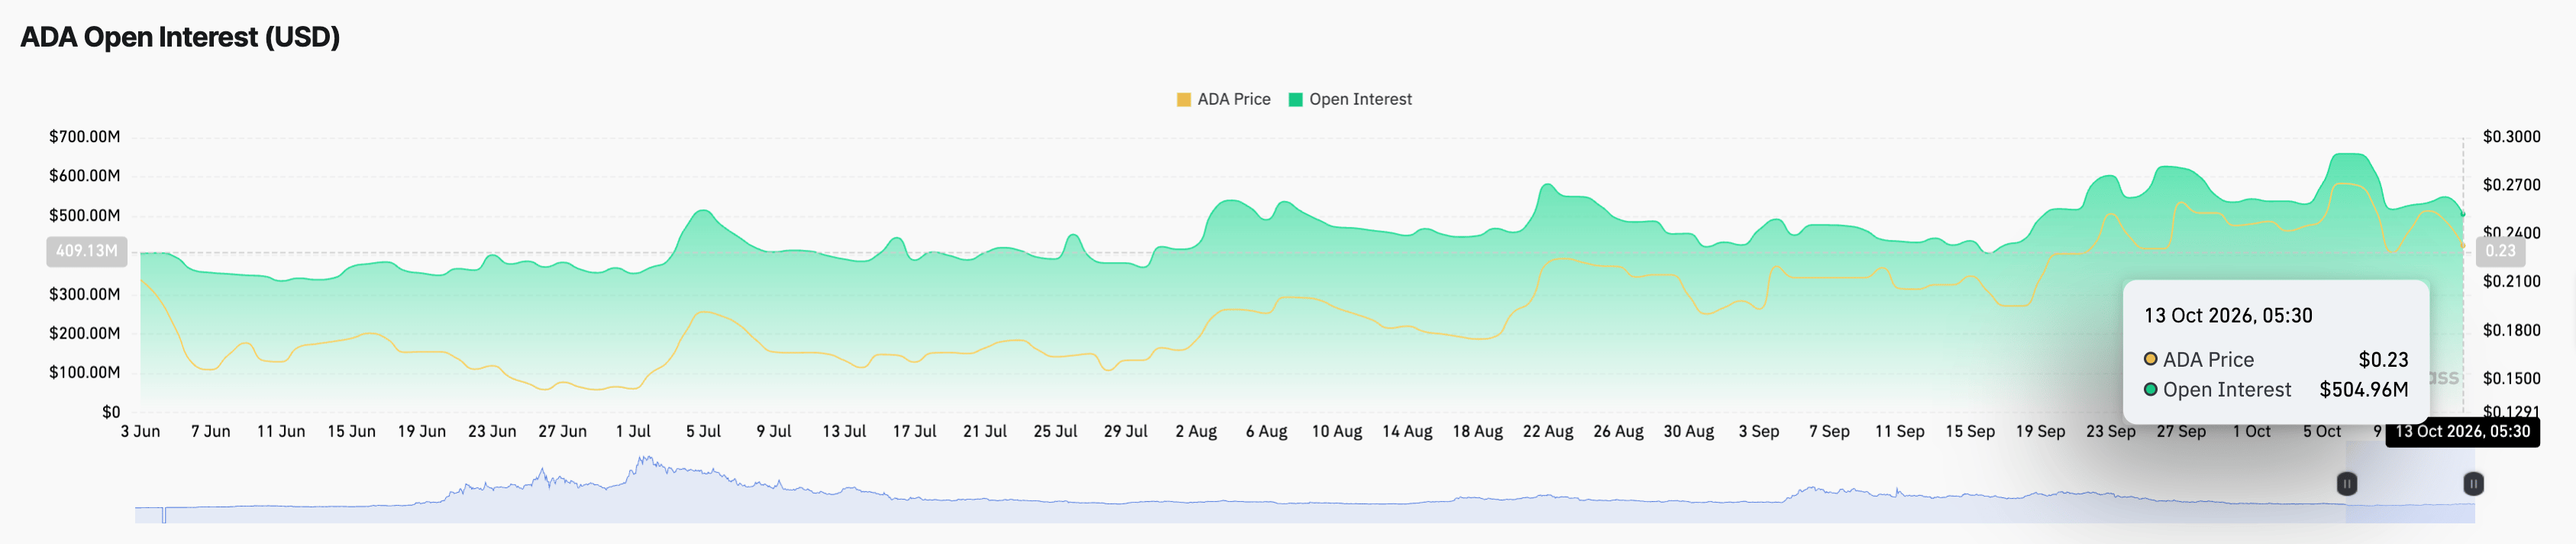
ADA Open Interest chart. Source: CoinGlass
ADA funding rate data. Source: CoinGlass

Technical outlook: Will Cardano witness a bearish trend reversal?

Cardano trades around $0.2374 at press time on Tuesday, following a decline of over 7% the previous day. ADA price is caught between the 50-day EMA at $0.2302, which underpins near-term support, and the 200-day EMA at $0.2414, which caps the topside, leaving the near-term bias neutral.

From a technical perspective, an upward-sloping trendline, connecting the July 28 and August 18 lows, with a break price of $0.2264, supports the rebound attempts. A confirmed breakout below this zone could test the August 30 low at $0.1894.

Momentum remains neutral to bearish on the daily chart, with the Moving Average Convergence Divergence (MACD) trending downward after crossing below its signal line, while the Relative Strength Index (RSI) at 48 remains neutral.

Chart Analysis ADA/USDT (Binance)
ADA/USDT daily price chart.

Looking up, Cardano must reclaim Monday's high at $0.2561 to open the path toward the February 14 high at $0.3007.

(The technical analysis of this story was written with the help of an AI tool. Know more.)

Disclaimer: For information purposes only. Past performance is not indicative of future results.
placeholder
Market News Today Australia: Oil Rallies, Gold Slips as US Dollar Hits 18-Month HighWTI crude rises as Middle East tensions support oil prices, while gold slips and US chip stocks weaken. Explore the latest market outlook for Australian CFD traders.
Author  Mitrade Team
15 hours ago
WTI crude rises as Middle East tensions support oil prices, while gold slips and US chip stocks weaken. Explore the latest market outlook for Australian CFD traders.
placeholder
Why Is the Korean Won Rising While Samsung and SK Hynix Fall?South Korean won climbed to a two-year high against the dollar on Monday. However, shares of the chipmakers whose dollar sales help support the currency traded in the red.The divergence emerged as Seo
Author  Beincrypto
16 hours ago
South Korean won climbed to a two-year high against the dollar on Monday. However, shares of the chipmakers whose dollar sales help support the currency traded in the red.The divergence emerged as Seo
placeholder
EUR/USD Hits 17-Month Low Near. Why the Euro Keeps Losing to the DollarThe euro has fallen to a 17-month low against the US dollar. EUR/USD touched 1.1161 on Oct. 5, its weakest level since May 2025.The pair has lost more than 3% in five weeks and traded near 1.1182 on M
Author  Beincrypto
16 hours ago
The euro has fallen to a 17-month low against the US dollar. EUR/USD touched 1.1161 on Oct. 5, its weakest level since May 2025.The pair has lost more than 3% in five weeks and traded near 1.1182 on M
placeholder
Top 3 Altcoins to Watch For the Second Week of October 2026Starknet (STRK), LayerZero (ZRO), and NEAR Protocol (NEAR) are the top 3 altcoins of the week by CoinGecko’s seven-day gains. However, the biggest gainer now shows the weakest chart.STRK rose 81.7% ov
Author  Beincrypto
16 hours ago
Starknet (STRK), LayerZero (ZRO), and NEAR Protocol (NEAR) are the top 3 altcoins of the week by CoinGecko’s seven-day gains. However, the biggest gainer now shows the weakest chart.STRK rose 81.7% ov
placeholder
US Dollar Hits 18-Month High: What It Means for Bitcoin and StocksThe US dollar is surging, and that could spell trouble for Bitcoin and Wall Street. The US Dollar Index (DXY) reached an 18-month high near 102.56 on Monday, while Bitcoin struggled around $83,000 and
Author  Beincrypto
16 hours ago
The US dollar is surging, and that could spell trouble for Bitcoin and Wall Street. The US Dollar Index (DXY) reached an 18-month high near 102.56 on Monday, while Bitcoin struggled around $83,000 and
Related Instrument
goTop
quote