




Chainlink Price Forecast: Short-term correction in LINK risks a bearish reversal to $10
- Chainlink is down over 3% on Wednesday, pressuring the crucial support level at $13.19.
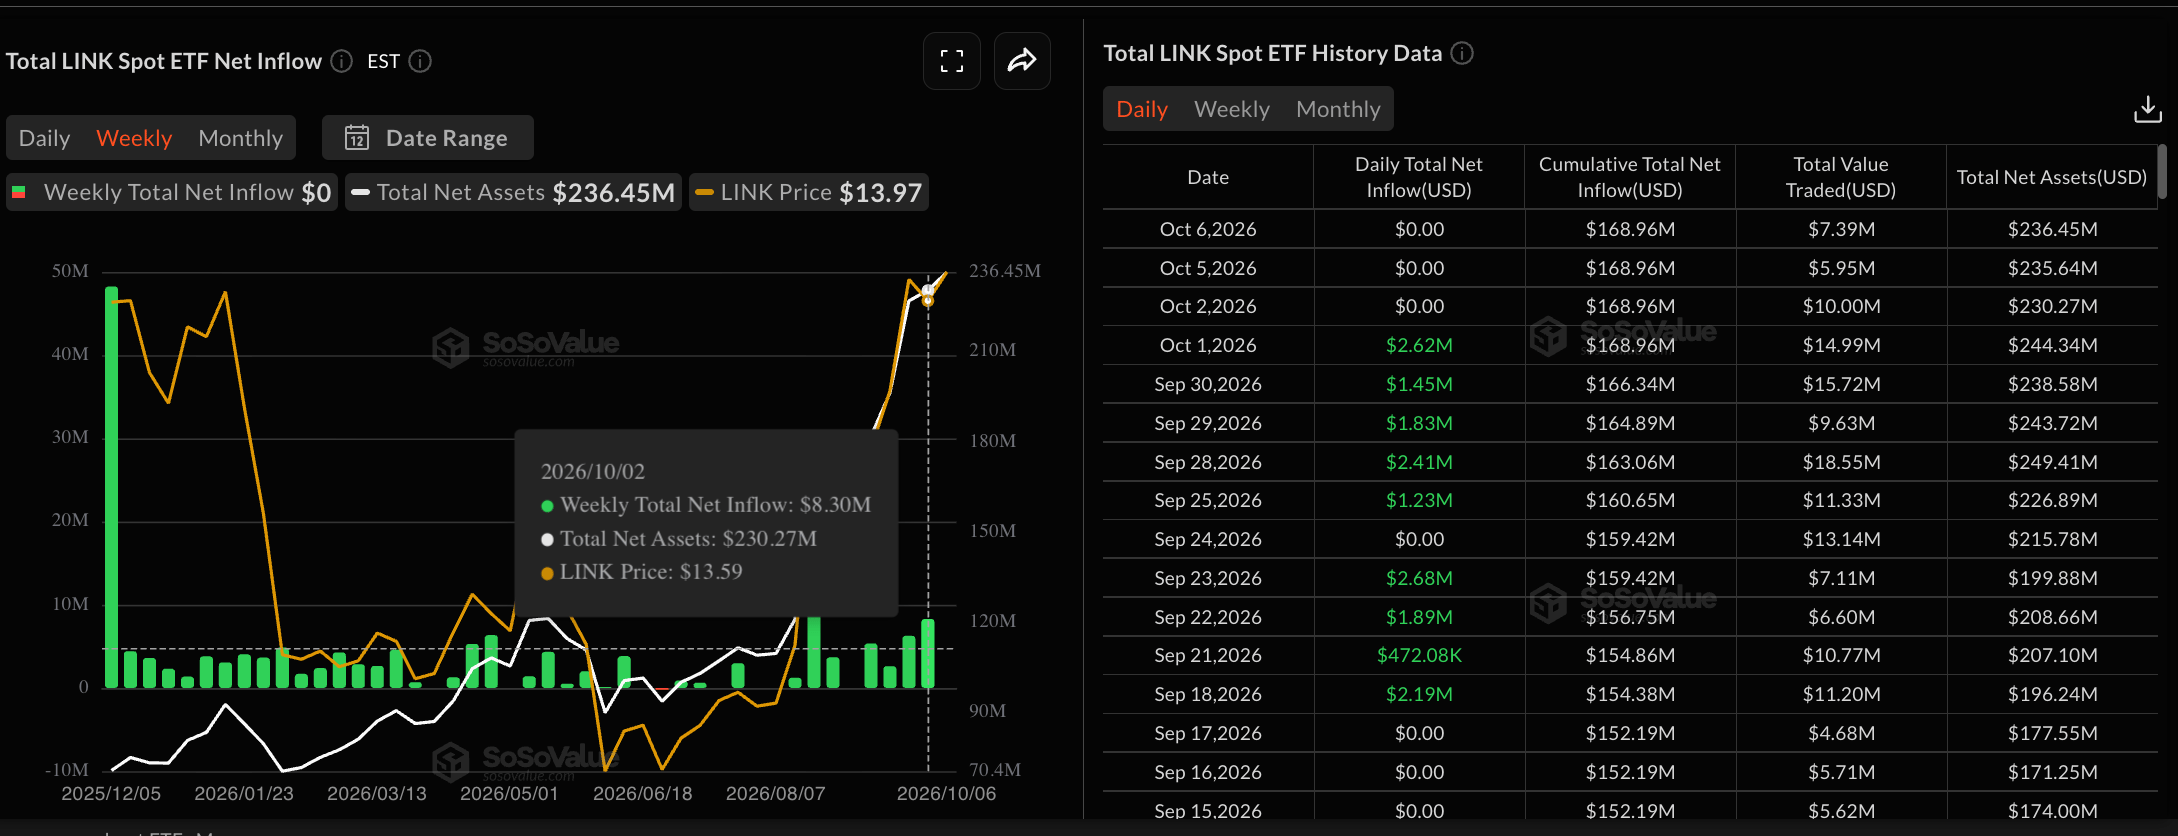
- Institutional demand remains muted so far this week, with zero inflows, down from $8.30 million the previous week.
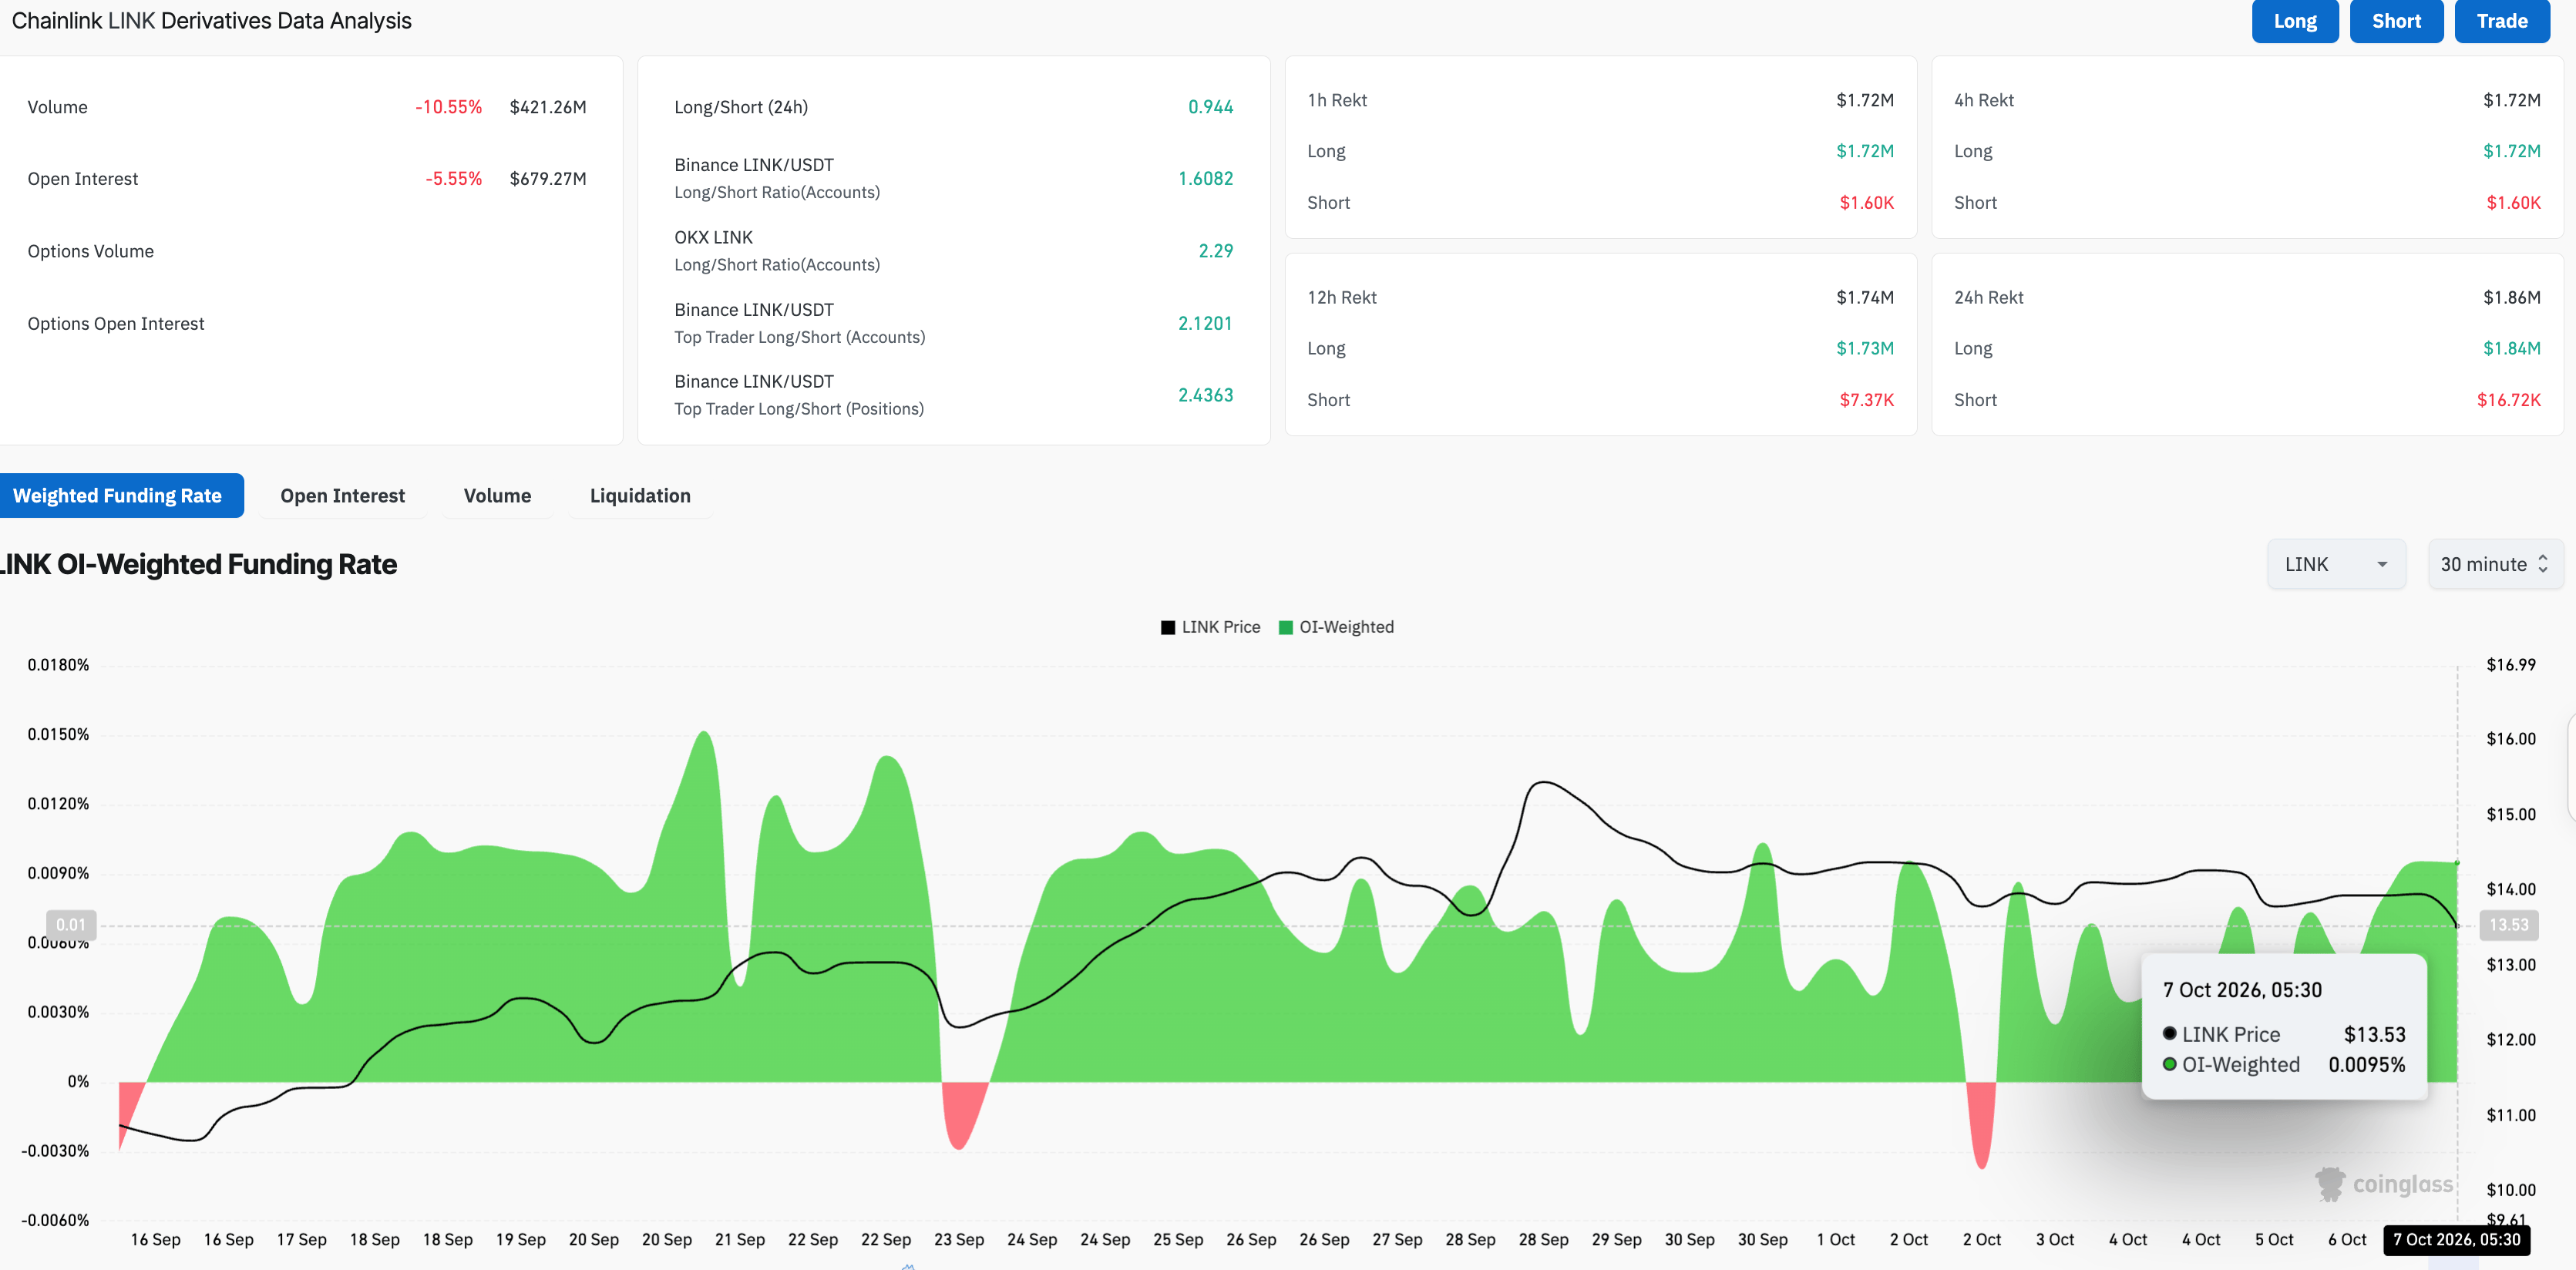
- Derivatives data shows a decline of over 5% in Open Interest over the last 24 hours, suggesting reduced exposure.
Chainlink (LINK) is down over 3% at press time on Wednesday, facing short-term weakness as institutional and retail demand eases. LINK-focused Exchange Traded Funds (ETFs) witnessed three consecutive days of zero inflows, while LINK futures Open Interest (OI) is down over 5%, suggesting a mild positional wipeout. The technical outlook for LINK is mixed, with a crucial support level near $13.19 in focus.
Declining retail and institutional inflows weigh on Chainlink
Chainlink is facing muted institutional inflows so far this week. SoSoValue data shows LINK-focused ETFs recorded zero inflows over the last three consecutive days, down from $8.30 million recorded last week. Despite zero inflows, LINK ETFs have seen little selling pressure from investor redemptions, with the last daily outflow of $390,580 recorded on August 13.
On the retail side, Chainlink futures show easing leverage exposure among traders. According to CoinGlass data, LINK Open Interest (OI) is down 5.55% over the last 24 hours to $679.27 million, suggesting a decline in the notional value of active positions, likely due to a lower spot price or a positional wipeout. Total liquidations of $1.86 million in the same period, driven by $1.84 million of long liquidations, reaffirms the positional wipeout thesis and a sell-side dominance.
Technical outlook: Chainlink faces downside risk as bearish momentum emerges
Chainlink trades below $13.50 at press time on Wednesday, extending a pullback from an overhead trendline near $14.00. The 50-period Exponential Moving Average (EMA) on the four-hour chart near $14.00 reinforces the overhead barrier.
Chainlink maintains a bearish near-term bias as its price trades below the 100-period EMA at $13.68, while the longer-term 200-period EMA at $12.87 remains lower, suggesting an intact broader uptrend.
Momentum is weak, with the Moving Average Convergence Divergence (MACD) declining into negative territory and the Relative Strength Index (RSI) at slipping below the midline, reinforcing the downside bias.
Looking down, immediate support is defined by the September 25 low around $13.10, ahead of the 200-period EMA at $12.87, where buyers would be expected to defend the larger bullish structure.
To reinstate an uptrend, LINK must reclaim the 50-period EMA and the active downward-sloping resistance trendline near $14.00. A confirmed breakout could extend toward last week's high around $15.77.
(The technical analysis of this story was written with the help of an AI tool. Know more.)
Recommended Articles


