




Crypto Today: Bitcoin rally slows while Ethereum and XRP extend recovery amid slowing ETF inflows
- Bitcoin’s upside cools, with short-term support at $85,000 and resistance below $88,000 as institutional demand wanes.
- Ethereum builds momentum for another breakout, trading above $2,700 despite $138 million in ETF outflows last week.
- XRP steadies above $1.52 as bulls extend the recovery despite slowing weekly ETF inflows.
Bitcoin (BTC) is narrowly consolidating while trading above $86,000 at the time of writing on Monday. The largest cryptocurrency by market capitalization is also holding in a broader range, with short-term support at $85,000 and resistance at $88,000.
Altcoins, on the other hand, show a positive outlook, with Ethereum (ETH) edging higher above $2,700 while Ripple (XRP) steadies above $1.52. The path of least resistance remains upward, with buyers taking on more risk.
Broadly, risk appetite in the crypto market is firmly positive, as reflected in the Fear & Greed Index, holding at 70 in Greed territory on Monday, up from 65 the day before. If this bullish outlook holds, buyers will take control of the trend, raising the odds that the recent rally extends.
Bitcoin and XRP ETFs draw inflows as Ethereum funds flip to outflows
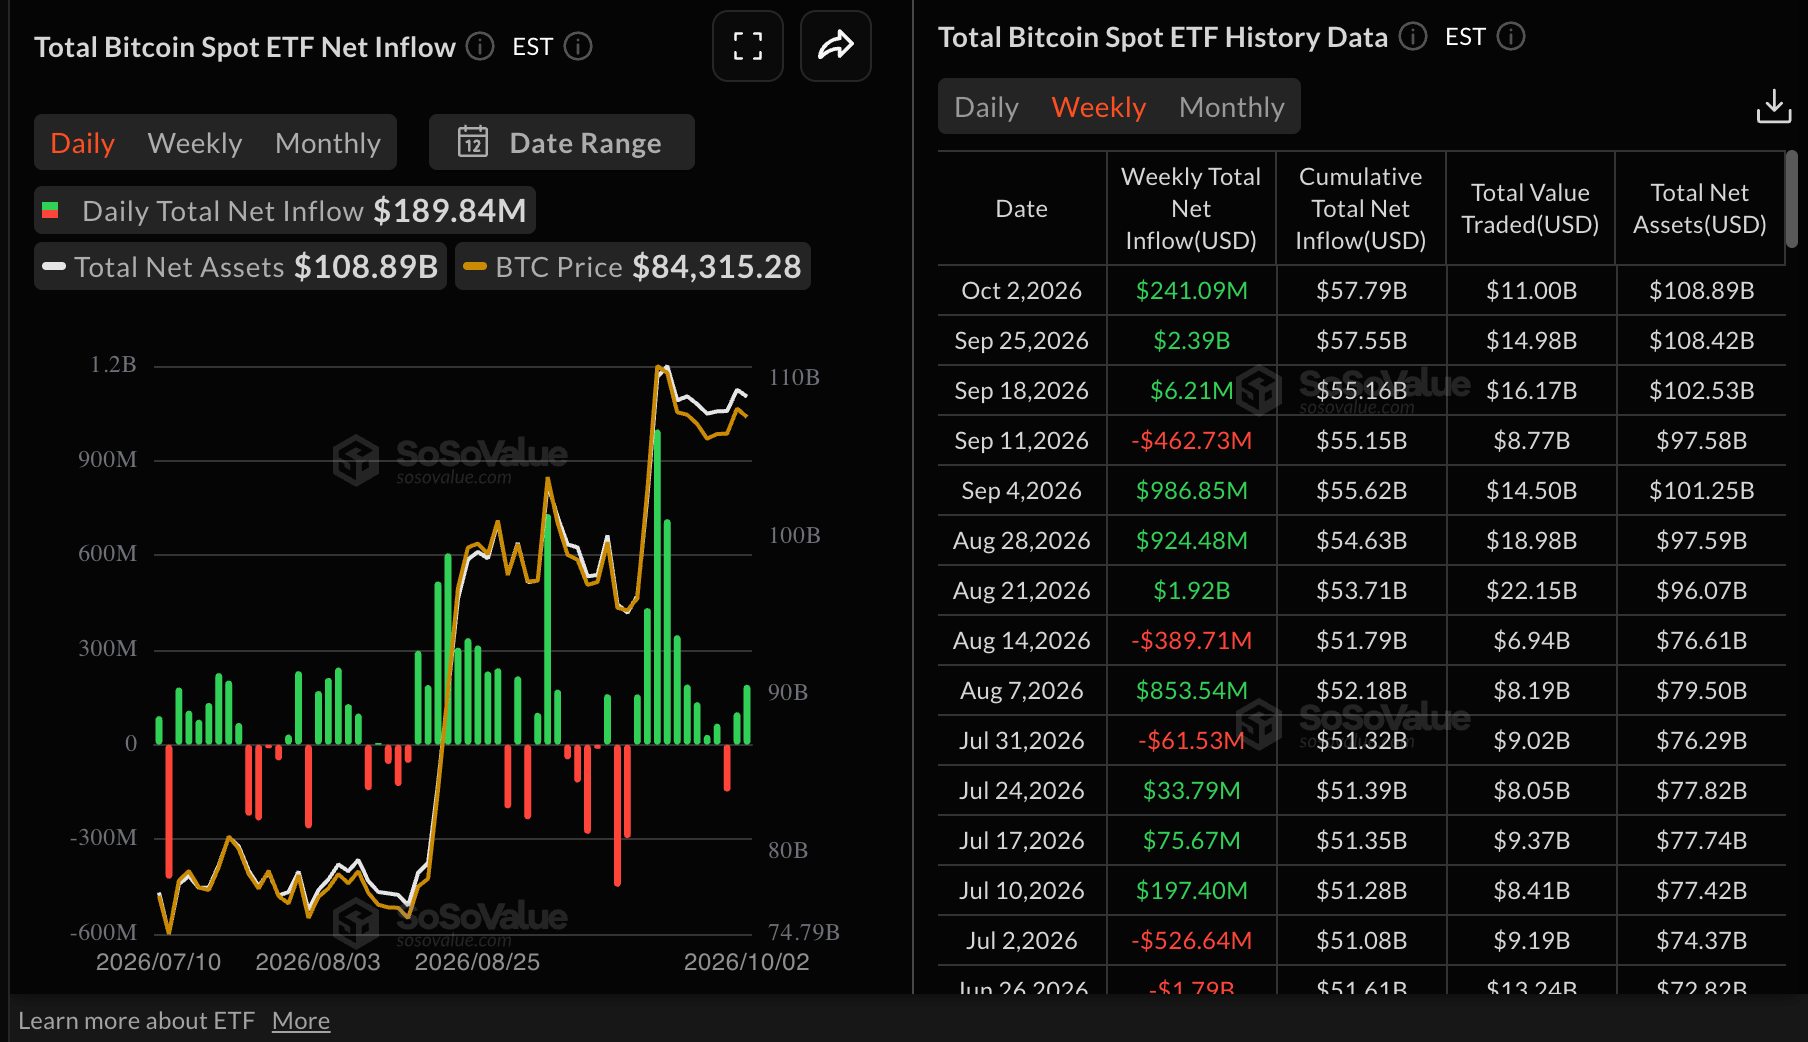
Bitcoin spot Exchange-Traded Funds (ETFs) extended the bullish streak for three consecutive weeks, with $241 million in inflows through Friday. This was a major setback from the previous week’s $2.4 billion in inflows, suggesting possible buyer exhaustion as BTC struggles to clear resistance at $88,000. Steady institutional support reinforces the larger bullish picture, while outflows imply fading risk-on sentiment.
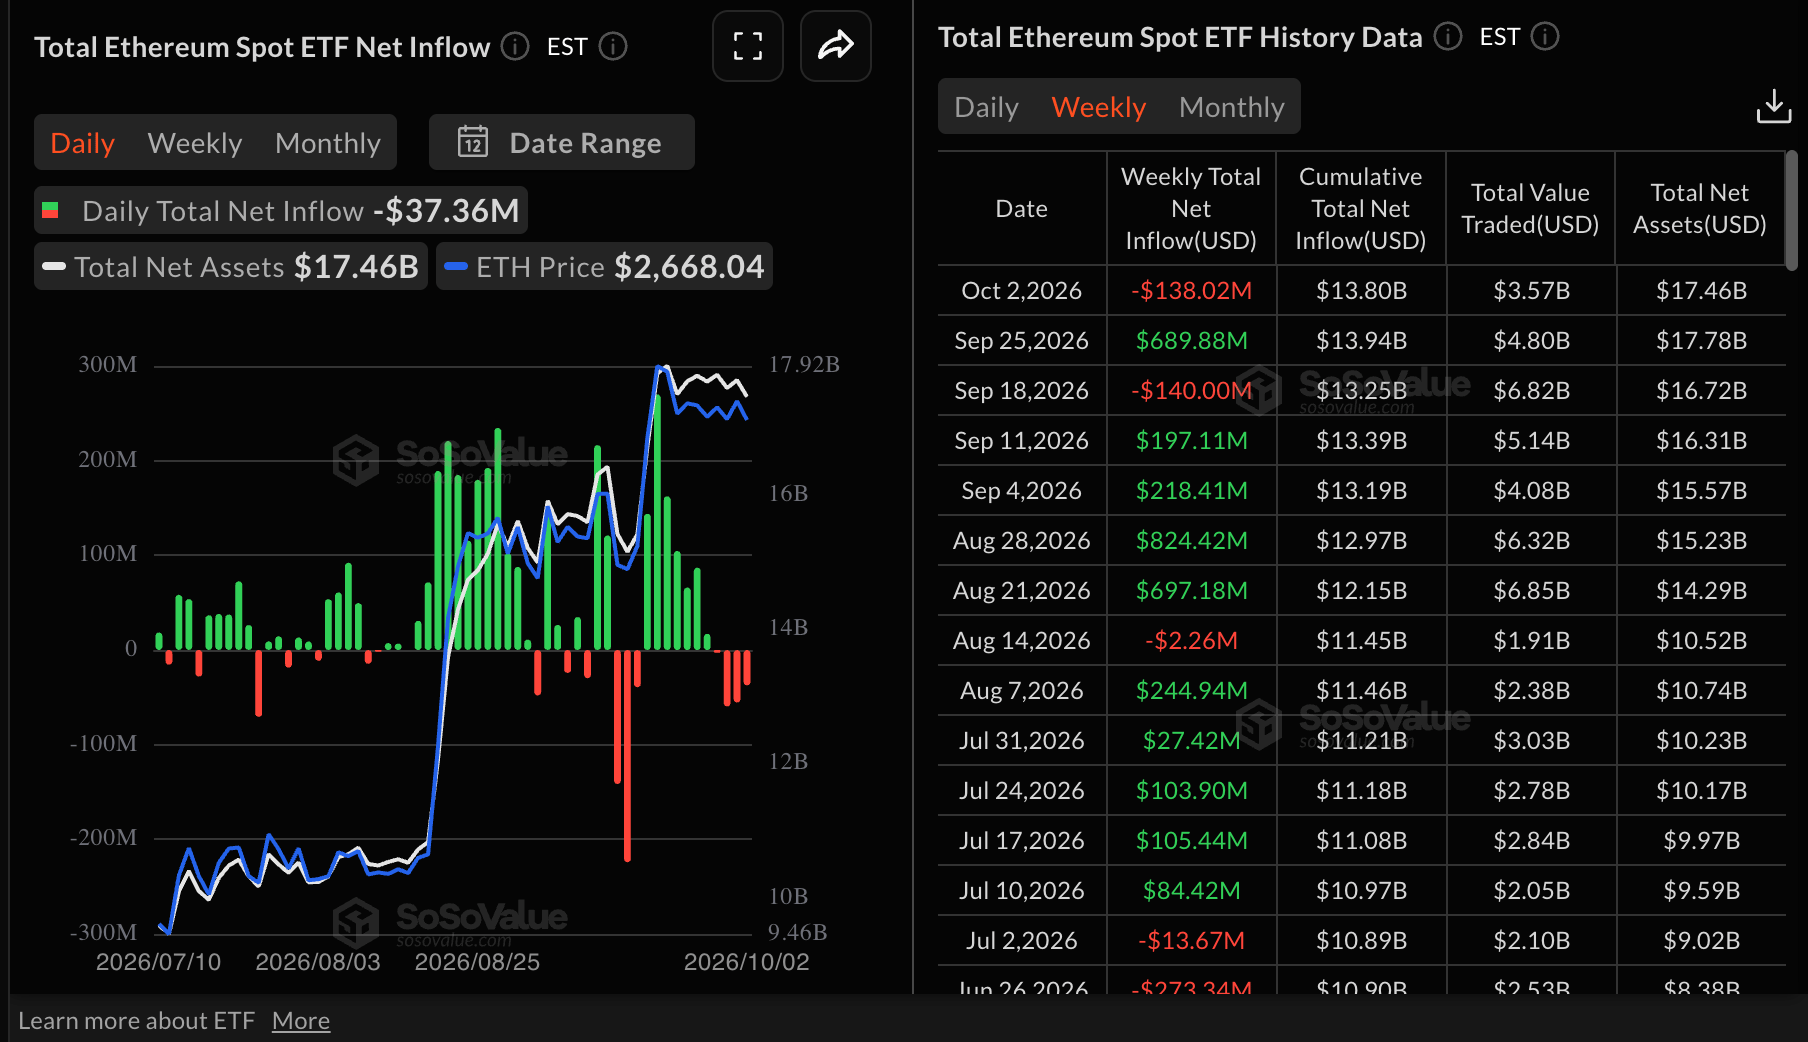
Ethereum spot ETFs, unlike Bitcoin, closed last week in the negative with outflows totaling $138 million, according to SoSoValue. The US-listed ETFs had recorded notable inflows of $690 m million in the week ending September 25. Despite the outflows, cumulative inflows stand at $13.8 billion, with net assets at $17.5 billion, affirming that investors retain a long-term outlook on Ethereum.
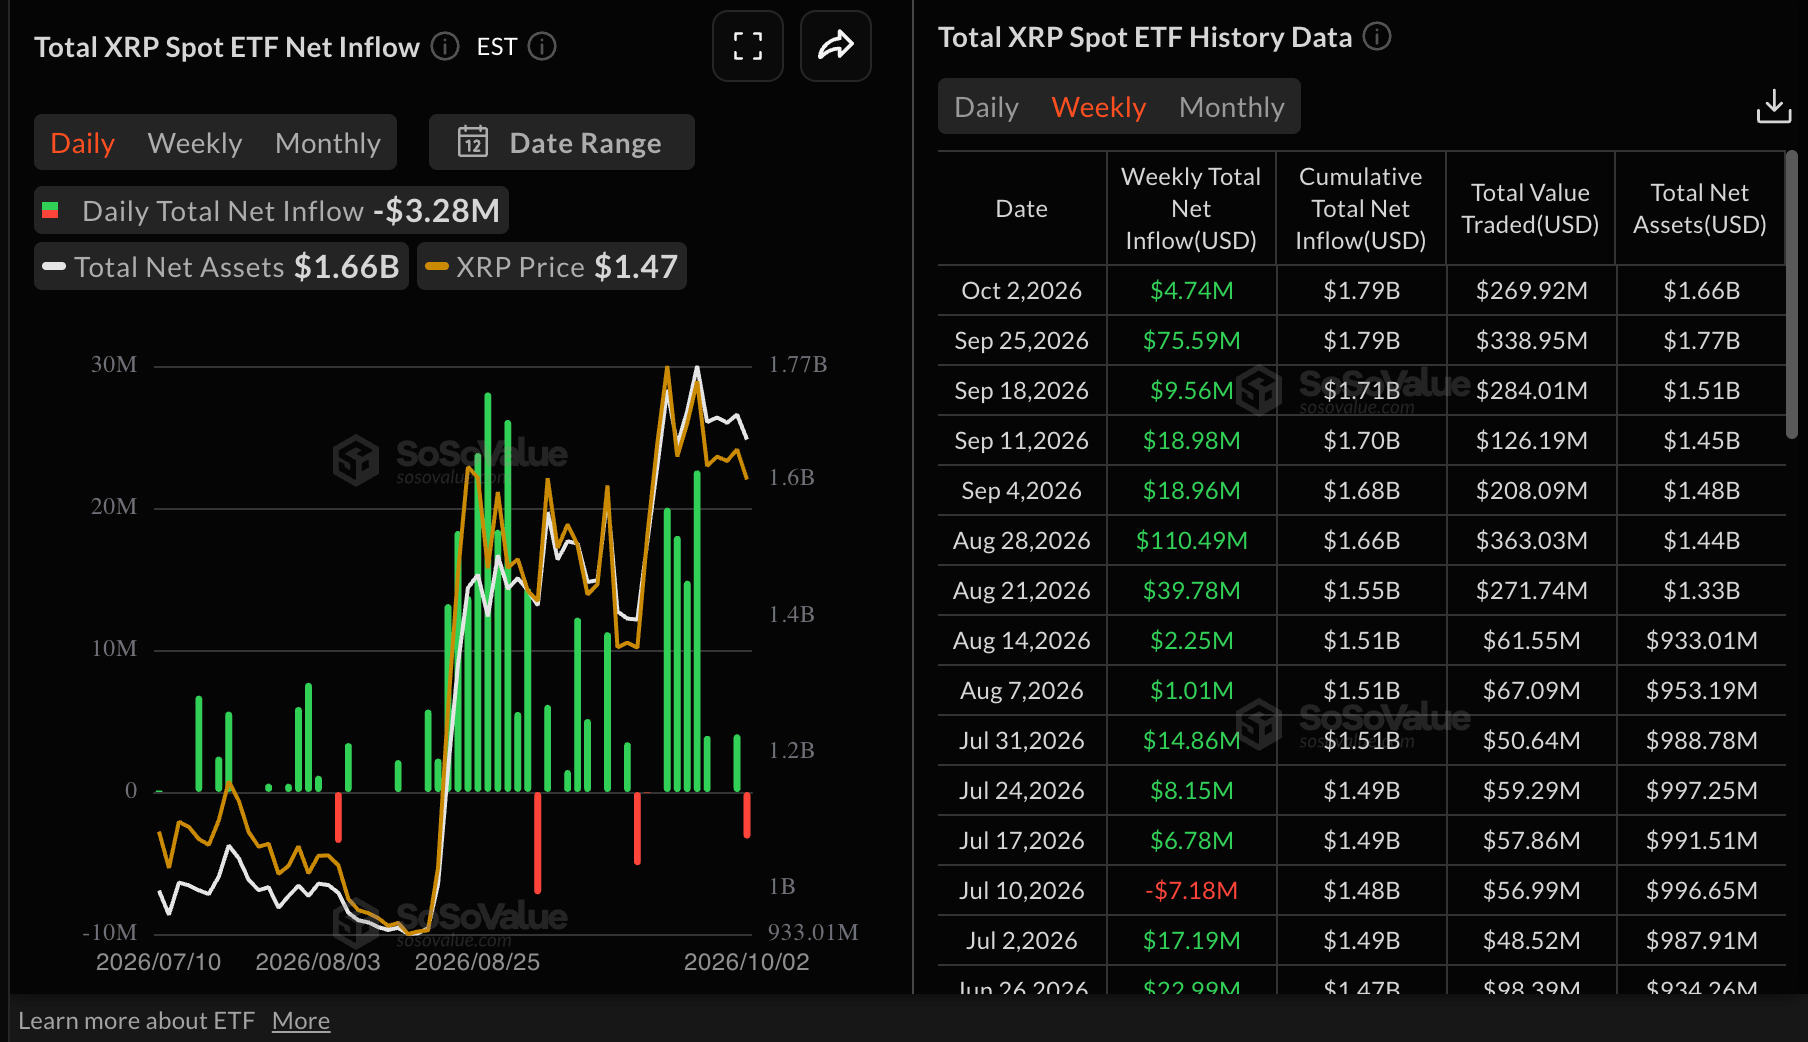
XRP spot ETFs extended their bullish streak last week with approximately $5million in inflows through Friday. According to SoSoValue, this marks the 12th consecutive week of inflows. Cumulatively, inflows total $1.8 billion, while net assets average $1.7 billion.
Technical analysis: Bitcoin ranges as support holds
Ethereum trades at $86,428, maintaining a bullish near-term bias despite supply at $88,000 capping upside. Meanwhile, the spot price holds well above the 50-day, 100-day and 200-day Exponential Moving Averages (EMAs) clustered between roughly $74,900 and $79,200.
The SuperTrend line at $79,910 reinforces this underlying demand zone, while a firm Relative Strength Index (RSI) around 68 suggests strong but approaching overbought momentum. At the same time, the Moving Average Convergence Divergence (MACD) remains slightly negative, hinting that upside traction is slowing rather than reversing.
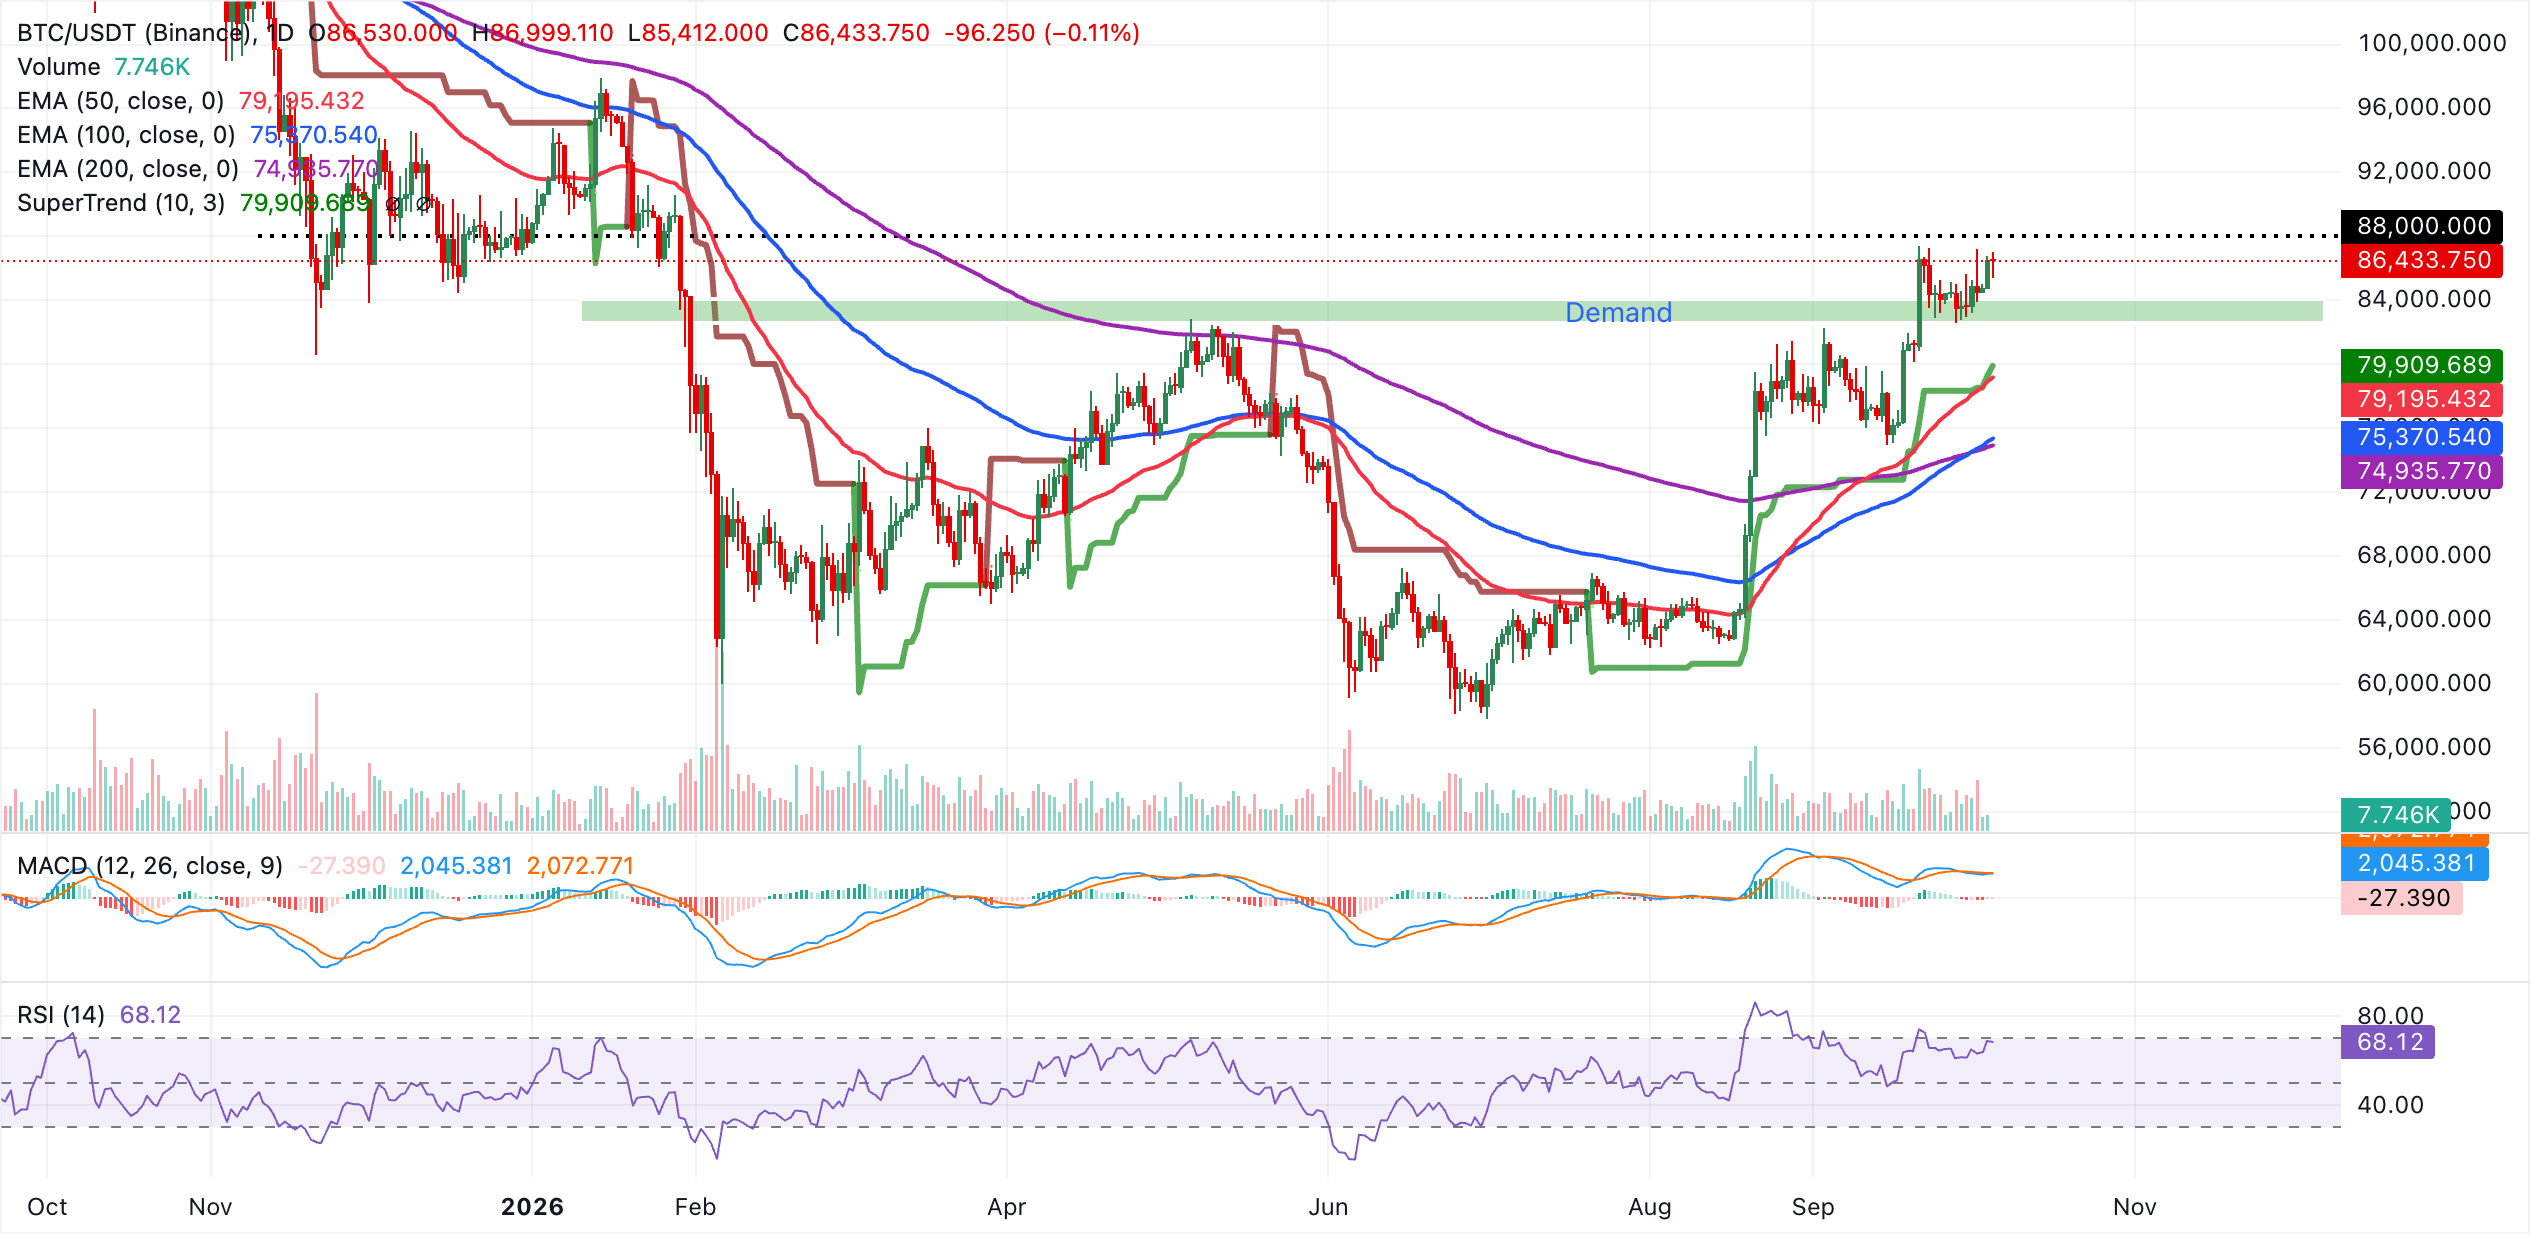
On the downside, initial support lies at the SuperTrend level, closely followed by the 50-day EMA at $79,195, forming a key short-term floor. Below this area, the 100-day EMA at $75,370 and the 200-day EMA at $74,936 constitute a deeper structural demand band. Only a decisive break beneath these averages would threaten the prevailing bullish outlook and open the way for a broader corrective phase.
Altcoins technical analysis: Ethereum and XRP extend gains
Ethereum trades at $2,727, maintaining a bullish near-term bias as price holds well above a rising cluster of EMAs. The 50-day EMA at $2,494, together with the SuperTrend base at $2,483, underpins the advance and suggests dips remain supported within the current uptrend.
The RSI at 64 stays in constructive territory without being overbought, while the MACD indicator, still marginally below zero, hints that bullish momentum is improving but not yet fully mature.
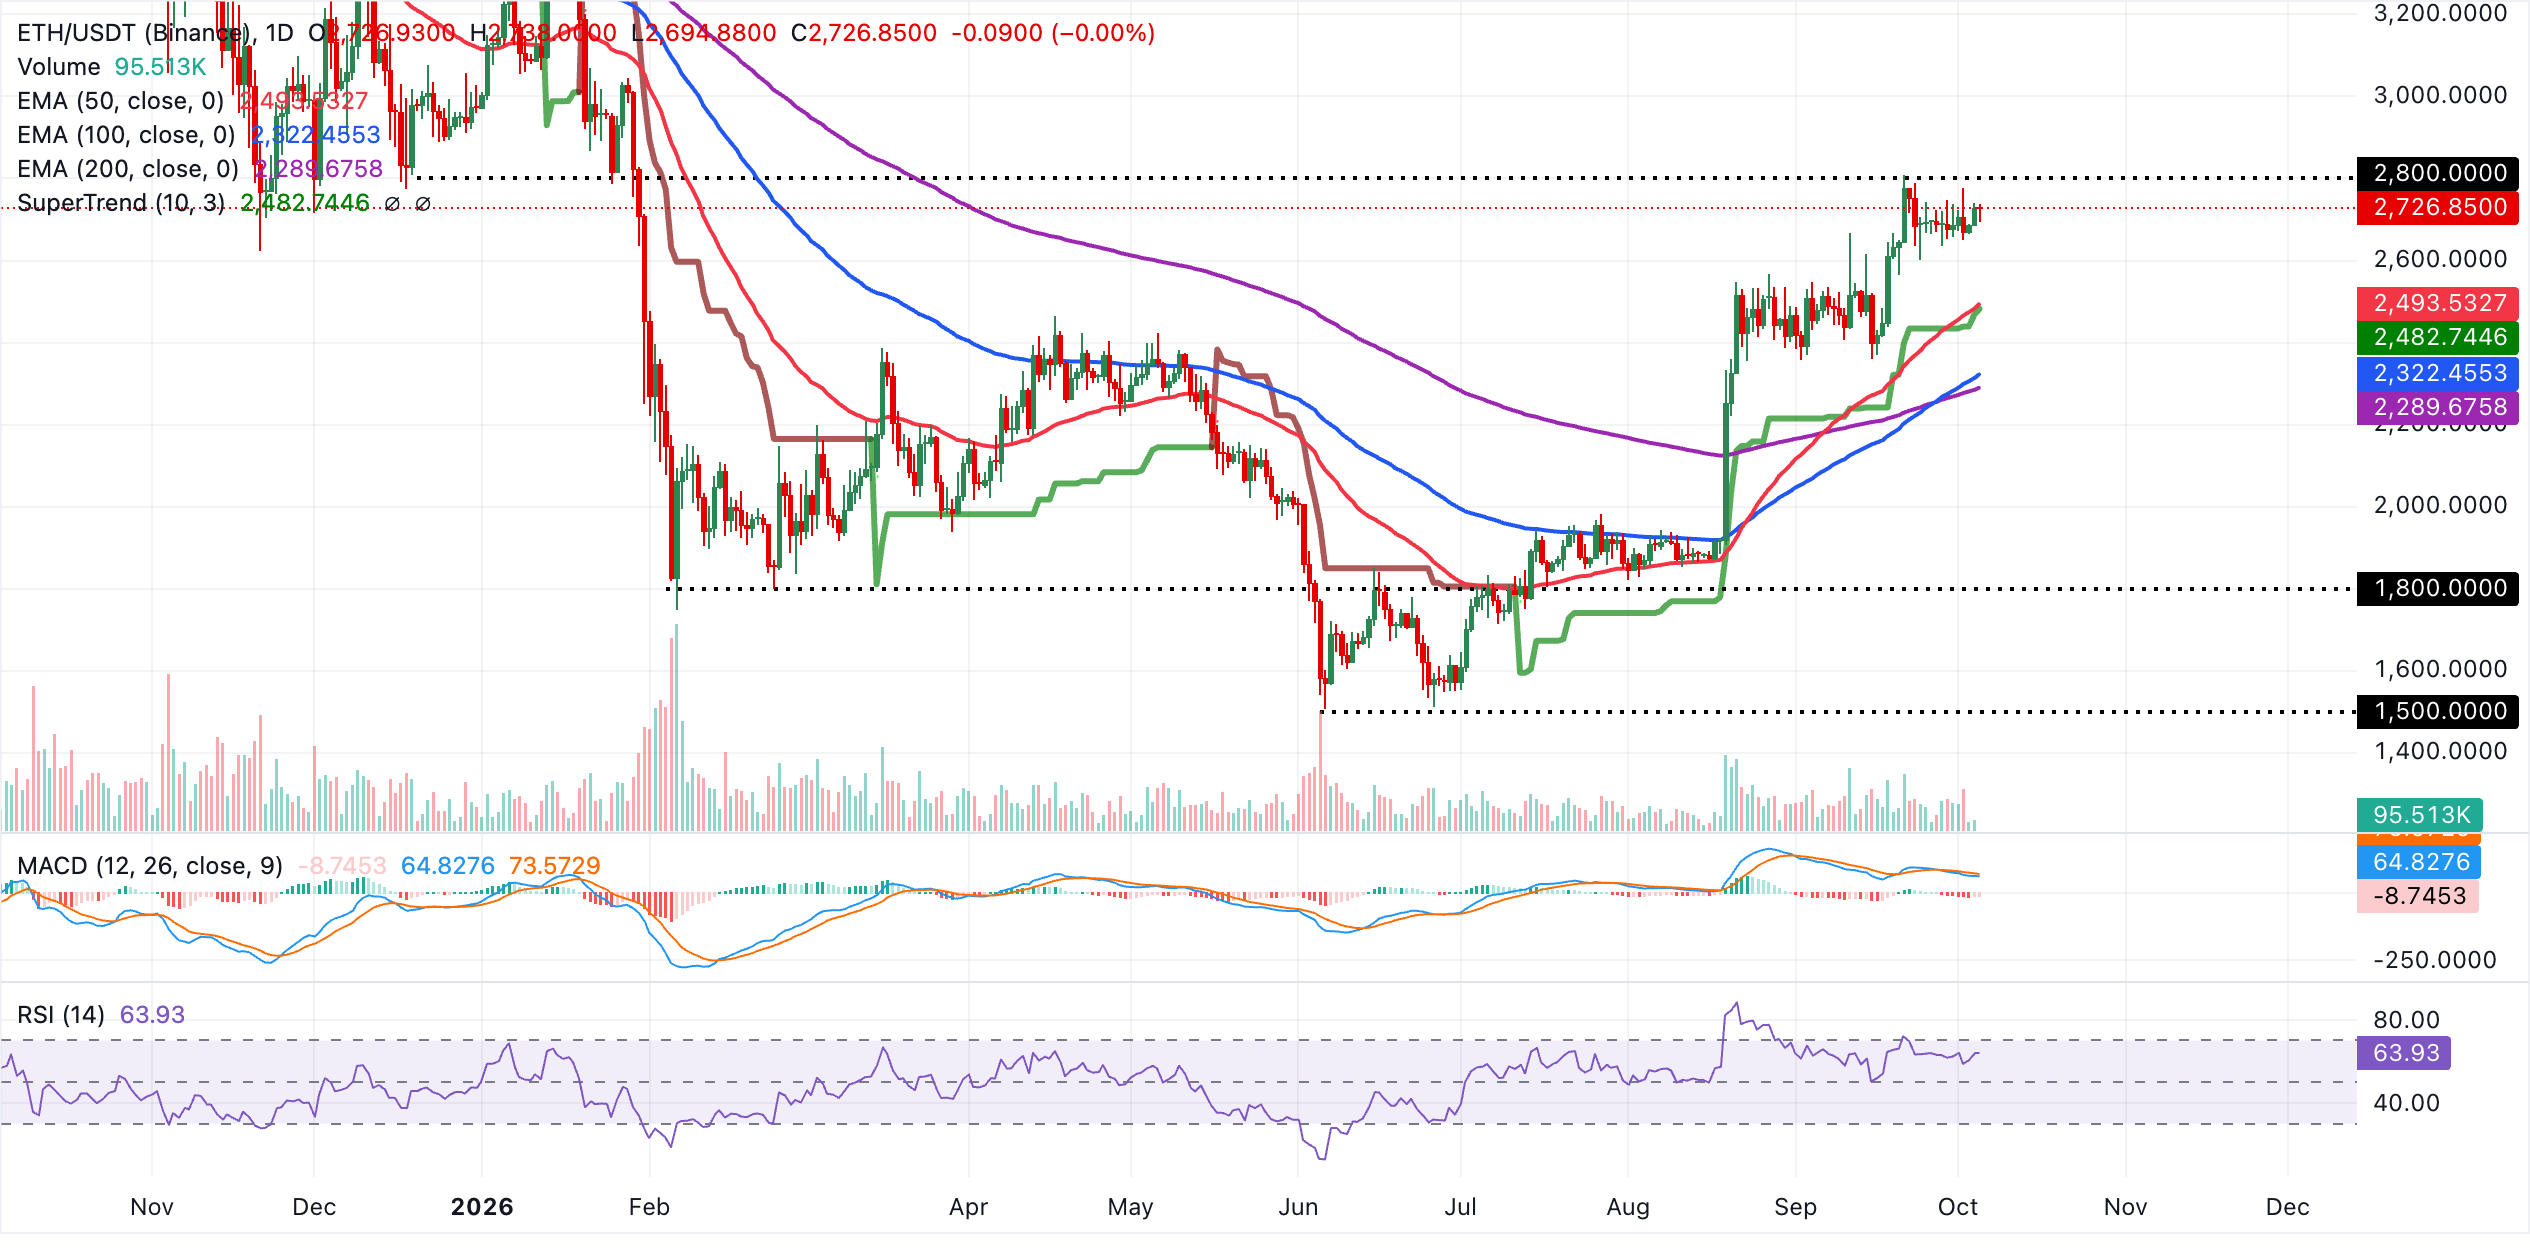
Initial support lies at the 50-day EMA near $2,494, closely backed by the SuperTrend line at $2,483, forming a dense demand zone for any pullback. Below this cluster, the 100-day EMA at $2,322 and the 200-day EMA at $2,290 provide deeper trend-supportive levels that would likely attract buyers if tested.
With no nearby overhead indicator resistances on the daily chart, the focus remains on how well ETH can defend these successive supports to extend the prevailing bullish structure.
XRP, meanwhile, trades at $1.52, holding a bullish near-term bias as price extends above the key EMAs. The 50-day EMA at $1.40 and the 200-day EMA at $1.38 sit well below the market, hinting at a constructive underlying trend, while the 100-day EMA at $1.33 and the SuperTrend line at $1.30 reinforce a broad support layer.
Momentum remains favorable, with the RSI at 59 staying in positive territory but shy of overbought, and the MACD showing a modestly negative reading, suggesting a pause within an overall improving upswing rather than a decisive reversal.
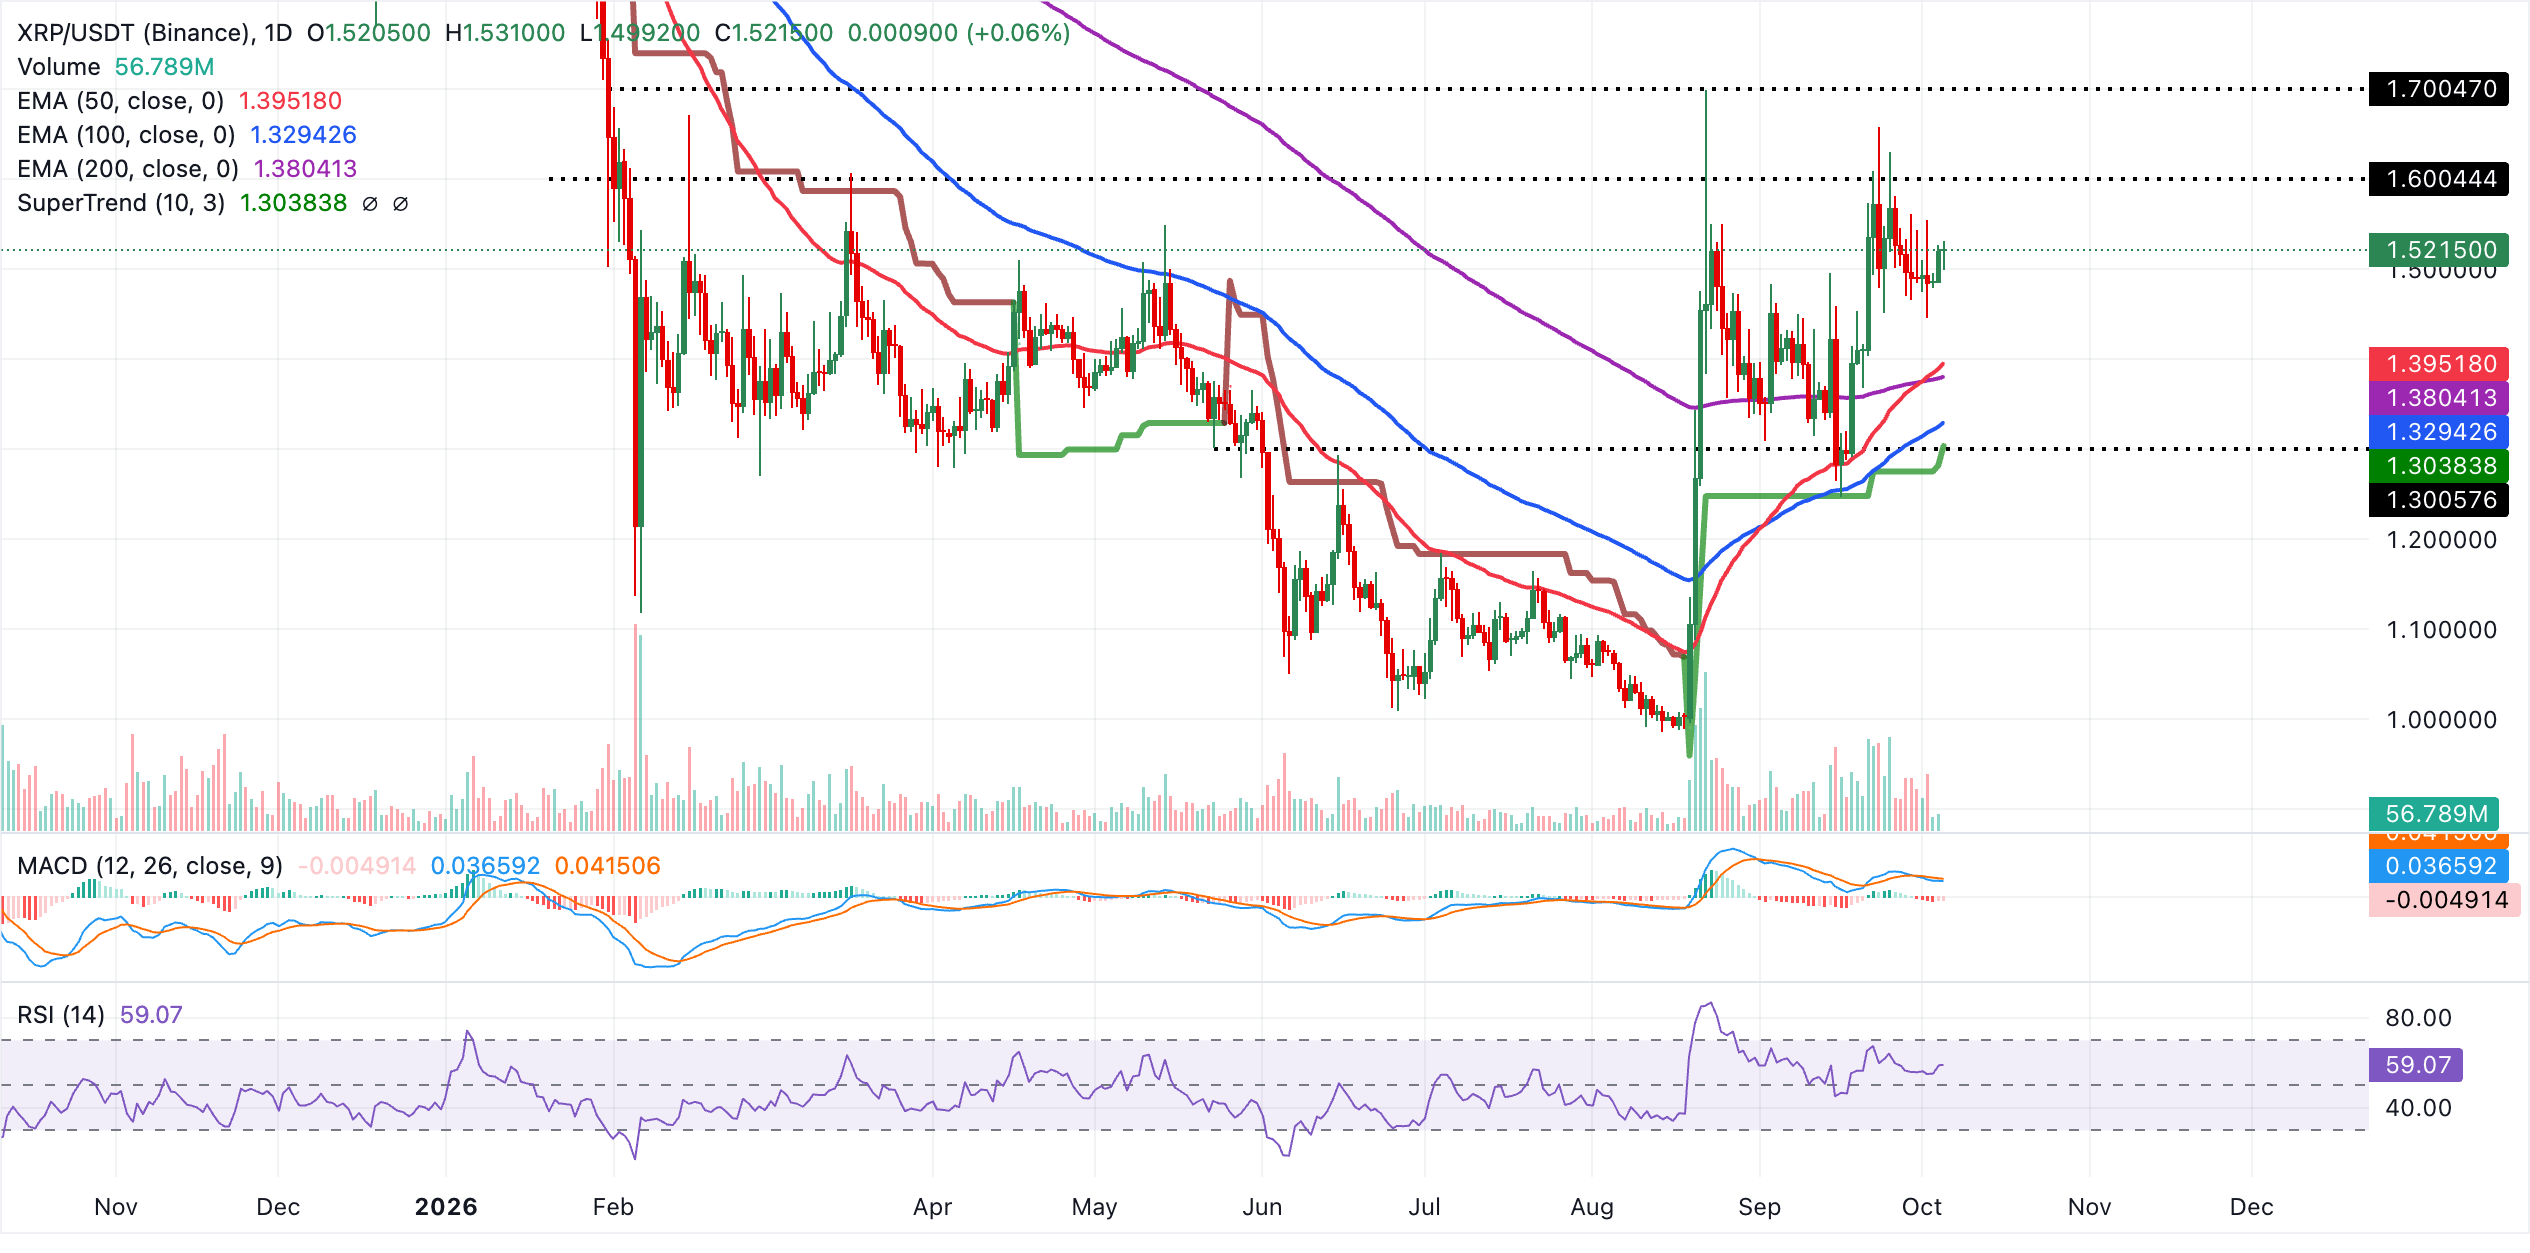
Initial technical support emerges around the 50-day EMA at $1.40, followed by the 200-day EMA near $1.38, both levels likely to attract dip-buying if price retreats. Deeper support lies at the 100-day EMA at $1.33 and the SuperTrend base around $1.30, where a break would materially weaken the prevailing bullish structure.
With resistance levels on the daily chart remaining undefined, the pair appears poised for further upside unless renewed selling pressure or waning momentum materializes. The technical setup currently supports consolidation above the clustered EMAs, preserving the potential for additional gains as long as $1.40 is maintained on a closing basis.
(The technical analysis of this story was written with the help of an AI tool. Know more.)
Crypto ETF FAQs
An Exchange-Traded Fund (ETF) is an investment vehicle or an index that tracks the price of an underlying asset. ETFs can not only track a single asset, but a group of assets and sectors. For example, a Bitcoin ETF tracks Bitcoin’s price. ETF is a tool used by investors to gain exposure to a certain asset.
Yes. The first Bitcoin futures ETF in the US was approved by the US Securities & Exchange Commission in October 2021. A total of seven Bitcoin futures ETFs have been approved, with more than 20 still waiting for the regulator’s permission. The SEC says that the cryptocurrency industry is new and subject to manipulation, which is why it has been delaying crypto-related futures ETFs for the last few years.
Yes. The SEC approved in January 2024 the listing and trading of several Bitcoin spot Exchange-Traded Funds, opening the door to institutional capital and mainstream investors to trade the main crypto currency. The decision was hailed by the industry as a game changer.
The main advantage of crypto ETFs is the possibility of gaining exposure to a cryptocurrency without ownership, reducing the risk and cost of holding the asset. Other pros are a lower learning curve and higher security for investors since ETFs take charge of securing the underlying asset holdings. As for the main drawbacks, the main one is that as an investor you can’t have direct ownership of the asset, or, as they say in crypto, “not your keys, not your coins.” Other disadvantages are higher costs associated with holding crypto since ETFs charge fees for active management. Finally, even though investing in ETFs reduces the risk of holding an asset, price swings in the underlying cryptocurrency are likely to be reflected in the investment vehicle too.
Recommended Articles


